
Houses for sale & to rent in Westerham, Bromley London Borough
House Prices in Westerham
Properties in this part of Westerham within the Bromley London Borough have an average house price of £463,089.00 and had 616 Property Transactions within the last 3 years.¹ This area has 4,816 households² , where the most expensive property was sold for £1,585,000.00.
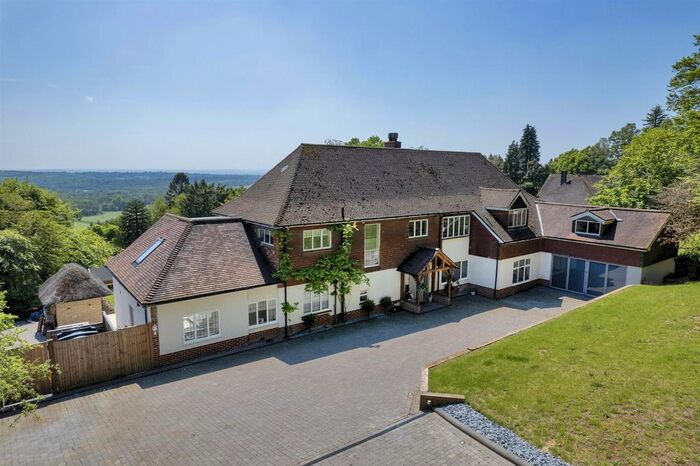
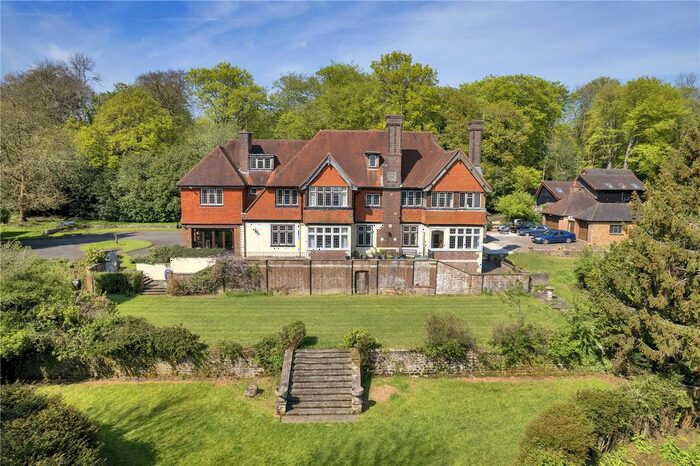
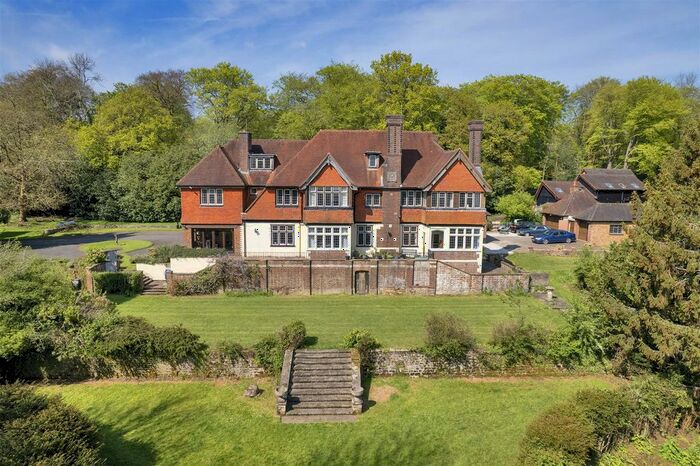
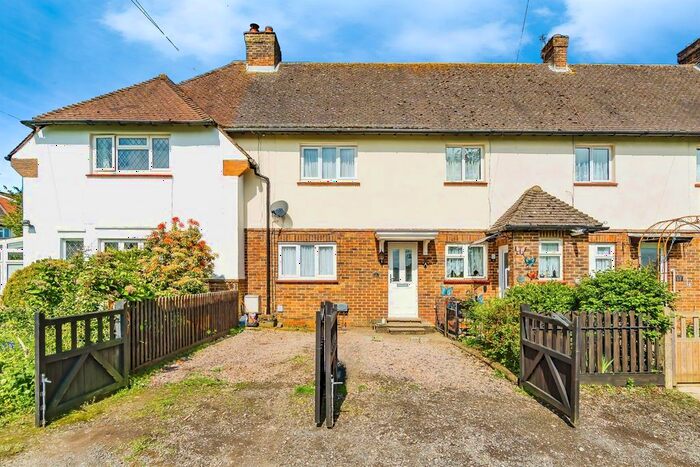
Properties for sale in Westerham


Neighbourhoods in Westerham
Navigate through our locations to find the location of your next house in Westerham, Bromley London Borough for sale or to rent.
Transport in Westerham
Please see below transportation links in this area:
-
 New Addington Station
 -
King Henry's Drive Station
-
Fieldway Station
-
 Woldingham Station
 -
Oxted Station
-
Addington Village Station
-
Chelsfield Station
-
Gravel Hill Station
-
Hayes Station
-
Hayes (Kent) Station
- FAQ
- Price Paid By Year
- Property Type Price
Frequently asked questions about Westerham
What is the average price for a property for sale in Westerham?
The average price for a property for sale in Westerham is £463,089. This amount is 20% lower than the average price in Bromley London Borough. There are 1,137 property listings for sale in Westerham.
What locations have the most expensive properties for sale in Westerham?
The location with the most expensive properties for sale in Westerham is Darwin at an average of £585,161.
What locations have the most affordable properties for sale in Westerham?
The location with the most affordable properties for sale in Westerham is Biggin Hill at an average of £441,382.
Which train stations are available in or near Westerham?
Some of the train stations available in or near Westerham are Woldingham, Oxted and Chelsfield.
Property Price Paid in Westerham by Year
The average sold property price by year was:
| Year | Average Sold Price | Price Change |
Sold Properties
|
|---|---|---|---|
| 2024 | £390,000 | -29% |
5 Properties |
| 2023 | £501,582 | 4% |
120 Properties |
| 2022 | £479,839 | 9% |
206 Properties |
| 2021 | £436,056 | 4% |
285 Properties |
| 2020 | £418,431 | 6% |
203 Properties |
| 2019 | £393,775 | 2% |
179 Properties |
| 2018 | £384,689 | -5% |
237 Properties |
| 2017 | £404,056 | -1% |
213 Properties |
| 2016 | £406,763 | 17% |
192 Properties |
| 2015 | £336,140 | 12% |
252 Properties |
| 2014 | £295,231 | 1% |
240 Properties |
| 2013 | £291,568 | 6% |
190 Properties |
| 2012 | £274,978 | -2% |
148 Properties |
| 2011 | £281,428 | 5% |
168 Properties |
| 2010 | £267,879 | 2% |
157 Properties |
| 2009 | £263,299 | -4% |
146 Properties |
| 2008 | £274,907 | - |
145 Properties |
| 2007 | £274,960 | 10% |
372 Properties |
| 2006 | £246,164 | -4% |
321 Properties |
| 2005 | £256,695 | 7% |
233 Properties |
| 2004 | £238,988 | 13% |
295 Properties |
| 2003 | £207,419 | 11% |
277 Properties |
| 2002 | £184,452 | 12% |
288 Properties |
| 2001 | £162,421 | 6% |
262 Properties |
| 2000 | £152,853 | 11% |
260 Properties |
| 1999 | £136,439 | 18% |
281 Properties |
| 1998 | £112,020 | 10% |
233 Properties |
| 1997 | £100,470 | 9% |
320 Properties |
| 1996 | £91,099 | 5% |
261 Properties |
| 1995 | £86,654 | - |
185 Properties |
Property Price per Property Type in Westerham
Here you can find historic sold price data in order to help with your property search.
The average Property Paid Price for specific property types in the last three years are:
| Property Type | Average Sold Price | Sold Properties |
|---|---|---|
| Flat | £268,218.00 | 94 Flats |
| Semi Detached House | £464,493.00 | 151 Semi Detached Houses |
| Terraced House | £407,529.00 | 159 Terraced Houses |
| Detached House | £590,163.00 | 212 Detached Houses |