
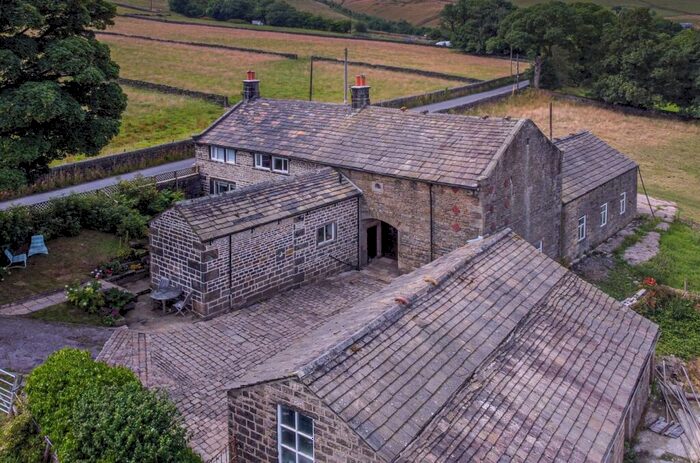
Houses for sale & to rent in Todmorden, Calderdale
House Prices in Todmorden
Properties in Todmorden have an average house price of £201,862.00 and had 891 Property Transactions within the last 3 years.¹
Todmorden is an area in Calderdale with 6,996 households², where the most expensive property was sold for £1,284,553.00.
Properties for sale in Todmorden


Neighbourhoods in Todmorden
Navigate through our locations to find the location of your next house in Todmorden, Calderdale for sale or to rent.
Transport in Todmorden
Please see below transportation links in this area:

- FAQ
- Price Paid By Year
- Property Type Price
Frequently asked questions about Todmorden
What is the average price for a property for sale in Todmorden?
The average price for a property for sale in Todmorden is £201,862. This amount is 5% higher than the average price in Calderdale. There are 1,655 property listings for sale in Todmorden.
What locations have the most expensive properties for sale in Todmorden?
The locations with the most expensive properties for sale in Todmorden are Cliviger with Worsthorne at an average of £800,000 and Calder at an average of £247,995.
What locations have the most affordable properties for sale in Todmorden?
The location with the most affordable properties for sale in Todmorden is Todmorden at an average of £188,740.
Which train stations are available in or near Todmorden?
Some of the train stations available in or near Todmorden are Todmorden, Walsden and Hebden Bridge.
Property Price Paid in Todmorden by Year
The average sold property price by year was:
| Year | Average Sold Price | Price Change |
Sold Properties
|
|---|---|---|---|
| 2024 | £161,659 | -26% |
19 Properties |
| 2023 | £203,295 | -3% |
219 Properties |
| 2022 | £209,024 | 6% |
314 Properties |
| 2021 | £196,556 | 10% |
339 Properties |
| 2020 | £177,446 | 7% |
269 Properties |
| 2019 | £165,896 | 6% |
264 Properties |
| 2018 | £156,626 | 11% |
287 Properties |
| 2017 | £140,097 | -10% |
295 Properties |
| 2016 | £153,646 | 15% |
248 Properties |
| 2015 | £130,195 | -1% |
279 Properties |
| 2014 | £131,085 | 2% |
244 Properties |
| 2013 | £128,604 | 5% |
168 Properties |
| 2012 | £122,102 | -4% |
141 Properties |
| 2011 | £126,466 | -15% |
147 Properties |
| 2010 | £145,574 | 10% |
199 Properties |
| 2009 | £131,205 | -5% |
167 Properties |
| 2008 | £137,450 | -8% |
242 Properties |
| 2007 | £147,966 | 14% |
396 Properties |
| 2006 | £127,942 | 11% |
385 Properties |
| 2005 | £114,316 | -1% |
346 Properties |
| 2004 | £115,292 | 28% |
364 Properties |
| 2003 | £83,573 | 17% |
360 Properties |
| 2002 | £68,981 | 17% |
421 Properties |
| 2001 | £57,291 | 9% |
321 Properties |
| 2000 | £51,939 | 3% |
326 Properties |
| 1999 | £50,154 | 5% |
275 Properties |
| 1998 | £47,613 | 4% |
270 Properties |
| 1997 | £45,926 | 9% |
262 Properties |
| 1996 | £41,597 | -7% |
220 Properties |
| 1995 | £44,381 | - |
233 Properties |
Property Price per Property Type in Todmorden
Here you can find historic sold price data in order to help with your property search.
The average Property Paid Price for specific property types in the last three years are:
| Property Type | Average Sold Price | Sold Properties |
|---|---|---|
| Semi Detached House | £242,279.00 | 119 Semi Detached Houses |
| Terraced House | £143,464.00 | 600 Terraced Houses |
| Detached House | £447,481.00 | 133 Detached Houses |
| Flat | £139,343.00 | 39 Flats |