
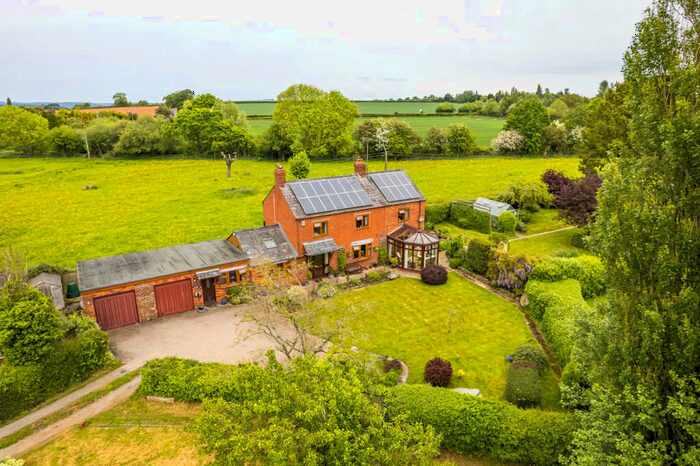
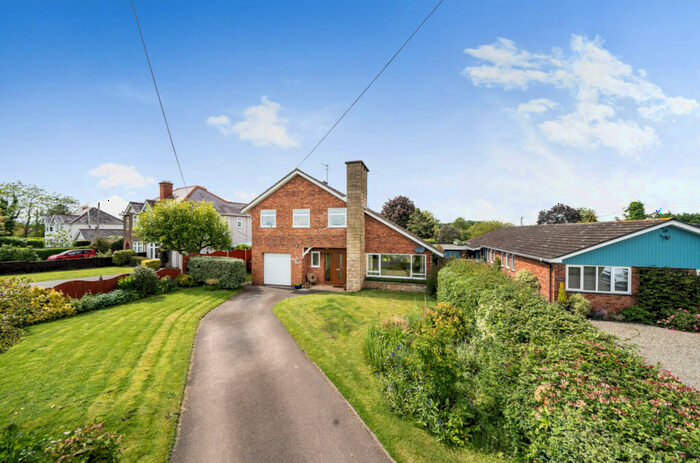
Houses for sale & to rent in County of Herefordshire, England
House Prices in County of Herefordshire
Properties in County of Herefordshire have
an average house price of
£319,679.00
and had 8,461 Property Transactions
within the last 3 years.¹
County of Herefordshire is a location in
England with
78,206 households², where the most expensive property was sold for £4,513,124.00.
Properties for sale in County of Herefordshire


Towns in County of Herefordshire
Navigate through our locations to find the location of your next house in County of Herefordshire, England for sale or to rent.
Transport in County of Herefordshire
Please see below transportation links in this area:

- FAQ
- Price Paid By Year
- Property Type Price
Frequently asked questions about County of Herefordshire
What is the average price for a property for sale in County of Herefordshire?
The average price for a property for sale in County of Herefordshire is £319,679. This amount is 11% lower than the average price in England. There are more than 10,000 property listings for sale in County of Herefordshire.
What locations have the most expensive properties for sale in County of Herefordshire?
The locations with the most expensive properties for sale in County of Herefordshire are Presteigne at an average of £659,076, Newent at an average of £647,500 and Drybrook at an average of £510,000.
What locations have the most affordable properties for sale in County of Herefordshire?
The locations with the most affordable properties for sale in County of Herefordshire are Kington at an average of £254,564, Leominster at an average of £296,397 and Hereford at an average of £299,253.
Which train stations are available in or near County of Herefordshire?
Some of the train stations available in or near County of Herefordshire are Hereford, Leominster and Ledbury.
Property Price Paid in County of Herefordshire by Year
The average sold property price by year was:
| Year | Average Sold Price | Price Change |
Sold Properties
|
|---|---|---|---|
| 2024 | £298,811 | -11% |
100 Properties |
| 2023 | £330,561 | -0,2% |
1,822 Properties |
| 2022 | £331,076 | 7% |
2,717 Properties |
| 2021 | £306,935 | 4% |
3,822 Properties |
| 2020 | £294,672 | 11% |
2,656 Properties |
| 2019 | £262,839 | 0,4% |
3,050 Properties |
| 2018 | £261,697 | 5% |
3,109 Properties |
| 2017 | £248,261 | 5% |
3,171 Properties |
| 2016 | £235,953 | 1% |
3,158 Properties |
| 2015 | £233,794 | 5% |
2,944 Properties |
| 2014 | £221,558 | 2% |
2,986 Properties |
| 2013 | £216,822 | 2% |
2,428 Properties |
| 2012 | £212,933 | -2% |
2,208 Properties |
| 2011 | £216,313 | -4% |
2,102 Properties |
| 2010 | £224,605 | 8% |
2,110 Properties |
| 2009 | £207,330 | -8% |
2,204 Properties |
| 2008 | £224,630 | 1% |
1,872 Properties |
| 2007 | £221,304 | 4% |
3,834 Properties |
| 2006 | £211,351 | 7% |
4,010 Properties |
| 2005 | £197,459 | 3% |
3,168 Properties |
| 2004 | £190,822 | 15% |
3,588 Properties |
| 2003 | £162,343 | 16% |
3,856 Properties |
| 2002 | £136,716 | 15% |
4,265 Properties |
| 2001 | £115,730 | 11% |
4,270 Properties |
| 2000 | £103,052 | 11% |
3,841 Properties |
| 1999 | £91,405 | 9% |
4,193 Properties |
| 1998 | £82,980 | 9% |
3,581 Properties |
| 1997 | £75,234 | 7% |
3,458 Properties |
| 1996 | £69,737 | 3% |
3,184 Properties |
| 1995 | £67,351 | - |
2,469 Properties |
Property Price per Property Type in County of Herefordshire
Here you can find historic sold price data in order to help with your property search.
The average Property Paid Price for specific property types in the last three years are:
| Property Type | Average Sold Price | Sold Properties |
|---|---|---|
| Terraced House | £213,269.00 | 1,913 Terraced Houses |
| Flat | £147,562.00 | 804 Flats |
| Semi Detached House | £266,268.00 | 2,114 Semi Detached Houses |
| Detached House | £444,983.00 | 3,630 Detached Houses |