
Houses for sale & to rent in Egremont, Cumbria
House Prices in Egremont
Properties in Egremont have an average house price of £149,850.00 and had 360 Property Transactions within the last 3 years.¹
Egremont is an area in Cumbria with 4,074 households², where the most expensive property was sold for £580,000.00.
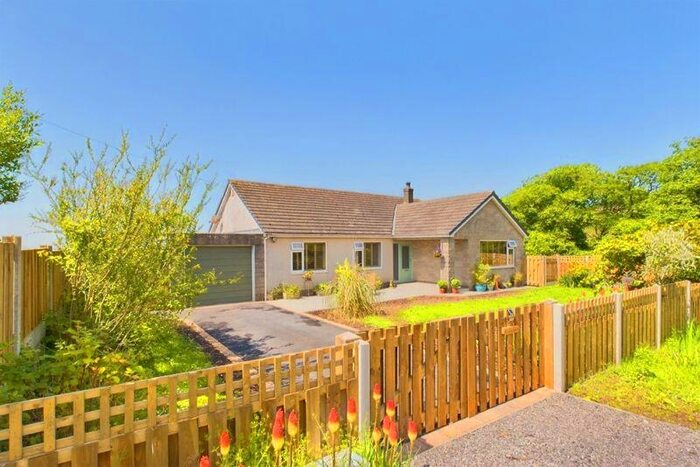
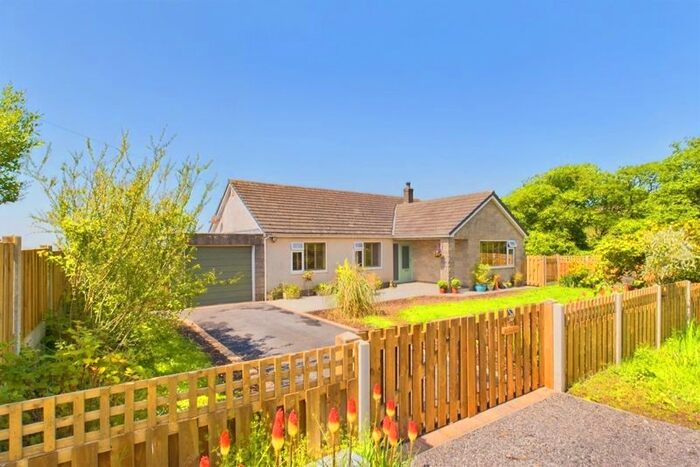
Properties for sale in Egremont


Neighbourhoods in Egremont
Navigate through our locations to find the location of your next house in Egremont, Cumbria for sale or to rent.
Transport in Egremont
Please see below transportation links in this area:

- FAQ
- Price Paid By Year
- Property Type Price
Frequently asked questions about Egremont
What is the average price for a property for sale in Egremont?
The average price for a property for sale in Egremont is £149,850. This amount is 37% lower than the average price in Cumbria. There are 2,653 property listings for sale in Egremont.
What locations have the most expensive properties for sale in Egremont?
The locations with the most expensive properties for sale in Egremont are St Bees at an average of £392,250, Beckermet at an average of £218,455 and Egremont South at an average of £133,627.
What locations have the most affordable properties for sale in Egremont?
The locations with the most affordable properties for sale in Egremont are Egremont at an average of £72,475 and Egremont North at an average of £125,349.
Which train stations are available in or near Egremont?
Some of the train stations available in or near Egremont are Nethertown, St.Bees and Braystones.
Property Price Paid in Egremont by Year
The average sold property price by year was:
| Year | Average Sold Price | Price Change |
Sold Properties
|
|---|---|---|---|
| 2024 | £132,200 | -4% |
5 Properties |
| 2023 | £138,015 | -15% |
88 Properties |
| 2022 | £158,084 | 5% |
122 Properties |
| 2021 | £150,712 | 16% |
145 Properties |
| 2020 | £127,068 | 7% |
127 Properties |
| 2019 | £117,781 | -9% |
119 Properties |
| 2018 | £128,595 | 3% |
124 Properties |
| 2017 | £124,635 | 7% |
113 Properties |
| 2016 | £115,626 | -7% |
122 Properties |
| 2015 | £123,626 | 4% |
133 Properties |
| 2014 | £118,493 | -2% |
124 Properties |
| 2013 | £120,804 | 1% |
95 Properties |
| 2012 | £119,509 | 2% |
97 Properties |
| 2011 | £116,753 | 3% |
92 Properties |
| 2010 | £112,681 | -9% |
86 Properties |
| 2009 | £123,045 | 5% |
102 Properties |
| 2008 | £116,398 | -5% |
102 Properties |
| 2007 | £121,707 | -3% |
229 Properties |
| 2006 | £124,909 | 12% |
221 Properties |
| 2005 | £110,492 | 7% |
179 Properties |
| 2004 | £103,050 | 38% |
220 Properties |
| 2003 | £63,780 | 17% |
168 Properties |
| 2002 | £52,846 | 11% |
151 Properties |
| 2001 | £47,153 | -7% |
125 Properties |
| 2000 | £50,250 | 9% |
108 Properties |
| 1999 | £45,518 | 6% |
125 Properties |
| 1998 | £42,892 | 9% |
102 Properties |
| 1997 | £39,218 | -13% |
95 Properties |
| 1996 | £44,260 | -3% |
97 Properties |
| 1995 | £45,385 | - |
112 Properties |
Property Price per Property Type in Egremont
Here you can find historic sold price data in order to help with your property search.
The average Property Paid Price for specific property types in the last three years are:
| Property Type | Average Sold Price | Sold Properties |
|---|---|---|
| Flat | £62,700.00 | 7 Flats |
| Semi Detached House | £127,890.00 | 100 Semi Detached Houses |
| Terraced House | £101,827.00 | 168 Terraced Houses |
| Detached House | £277,778.00 | 85 Detached Houses |