
Houses for sale & to rent in Wigton, Cumbria
House Prices in Wigton
Properties in Wigton have an average house price of £205,785.00 and had 1,029 Property Transactions within the last 3 years.¹
Wigton is an area in Cumbria with 9,869 households², where the most expensive property was sold for £925,000.00.
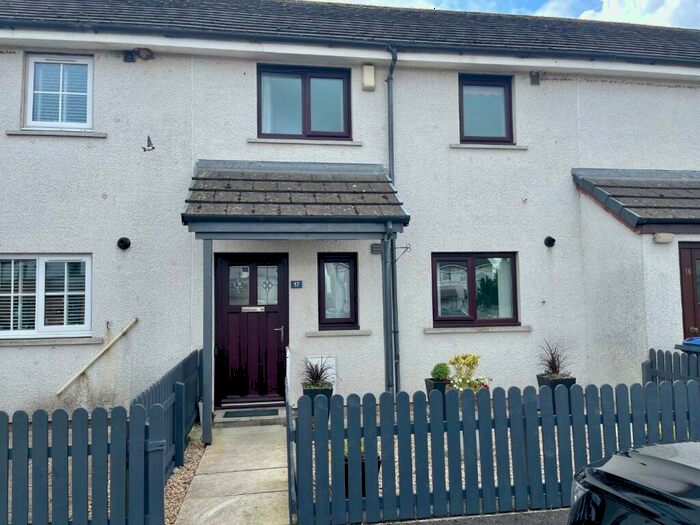
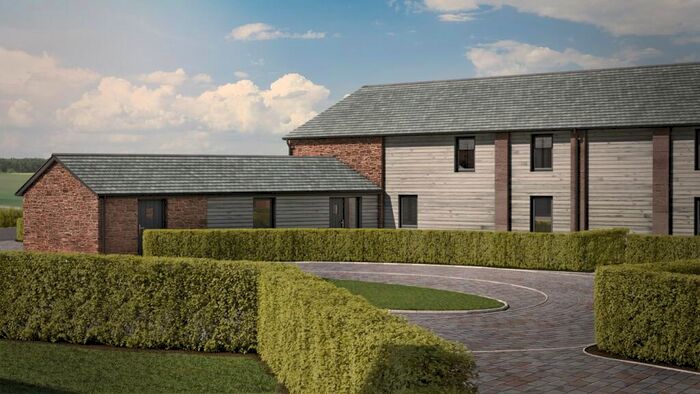
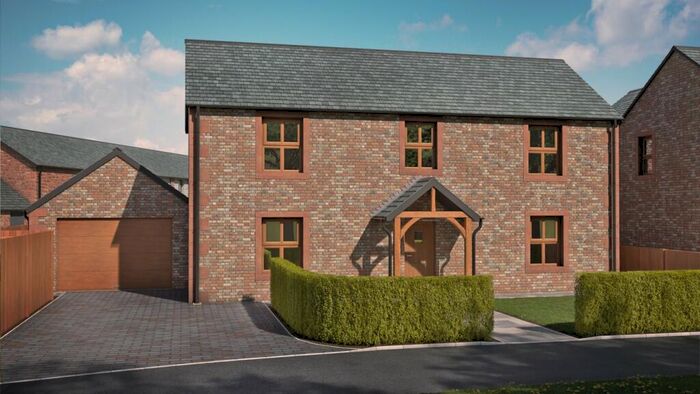
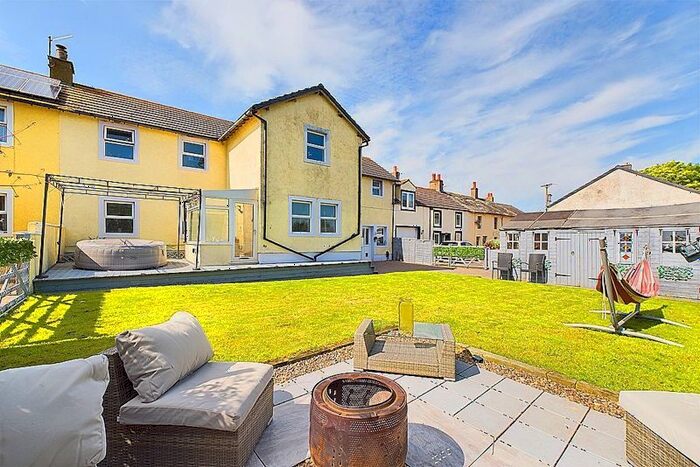
Properties for sale in Wigton


Neighbourhoods in Wigton
Navigate through our locations to find the location of your next house in Wigton, Cumbria for sale or to rent.
Transport in Wigton
Please see below transportation links in this area:
-
 Wigton Station
 -
Aspatria Station
-
Dalston Station
-
Maryport Station
-
Annan Station
-
Carlisle Station
-
Flimby Station
- FAQ
- Price Paid By Year
- Property Type Price
Frequently asked questions about Wigton
What is the average price for a property for sale in Wigton?
The average price for a property for sale in Wigton is £205,785. This amount is 6% lower than the average price in Cumbria. There are 5,864 property listings for sale in Wigton.
What locations have the most expensive properties for sale in Wigton?
The locations with the most expensive properties for sale in Wigton are Warnell at an average of £407,030, Boltons at an average of £351,546 and Skelton at an average of £348,500.
What locations have the most affordable properties for sale in Wigton?
The locations with the most affordable properties for sale in Wigton are Aspatria at an average of £140,511, Wigton at an average of £159,302 and Silloth at an average of £162,307.
Which train stations are available in or near Wigton?
Some of the train stations available in or near Wigton are Wigton, Aspatria and Dalston.
Property Price Paid in Wigton by Year
The average sold property price by year was:
| Year | Average Sold Price | Price Change |
Sold Properties
|
|---|---|---|---|
| 2024 | £185,326 | -13% |
26 Properties |
| 2023 | £209,747 | -5% |
231 Properties |
| 2022 | £219,974 | 12% |
335 Properties |
| 2021 | £194,031 | -0,2% |
437 Properties |
| 2020 | £194,499 | 12% |
335 Properties |
| 2019 | £171,187 | -2% |
385 Properties |
| 2018 | £175,450 | 4% |
358 Properties |
| 2017 | £168,684 | 10% |
349 Properties |
| 2016 | £151,498 | 5% |
315 Properties |
| 2015 | £143,523 | -9% |
292 Properties |
| 2014 | £156,608 | 2% |
318 Properties |
| 2013 | £154,101 | -5% |
269 Properties |
| 2012 | £161,573 | 5% |
223 Properties |
| 2011 | £153,626 | -12% |
252 Properties |
| 2010 | £172,127 | 7% |
230 Properties |
| 2009 | £159,407 | 3% |
194 Properties |
| 2008 | £155,123 | -5% |
192 Properties |
| 2007 | £162,784 | 3% |
471 Properties |
| 2006 | £158,114 | 10% |
451 Properties |
| 2005 | £142,538 | 10% |
385 Properties |
| 2004 | £127,979 | 22% |
459 Properties |
| 2003 | £100,255 | 20% |
445 Properties |
| 2002 | £79,926 | 10% |
502 Properties |
| 2001 | £72,013 | 10% |
436 Properties |
| 2000 | £65,082 | 7% |
397 Properties |
| 1999 | £60,423 | -2% |
374 Properties |
| 1998 | £61,633 | 7% |
385 Properties |
| 1997 | £57,102 | 14% |
338 Properties |
| 1996 | £49,346 | -7% |
397 Properties |
| 1995 | £52,958 | - |
277 Properties |
Property Price per Property Type in Wigton
Here you can find historic sold price data in order to help with your property search.
The average Property Paid Price for specific property types in the last three years are:
| Property Type | Average Sold Price | Sold Properties |
|---|---|---|
| Terraced House | £131,619.00 | 335 Terraced Houses |
| Flat | £81,609.00 | 32 Flats |
| Semi Detached House | £176,813.00 | 266 Semi Detached Houses |
| Detached House | £298,022.00 | 396 Detached Houses |