
Houses for sale & to rent in Bakewell, Derbyshire
House Prices in Bakewell
Properties in Bakewell have an average house price of £464,907.00 and had 392 Property Transactions within the last 3 years.¹
Bakewell is an area in Derbyshire with 3,951 households², where the most expensive property was sold for £3,850,000.00.
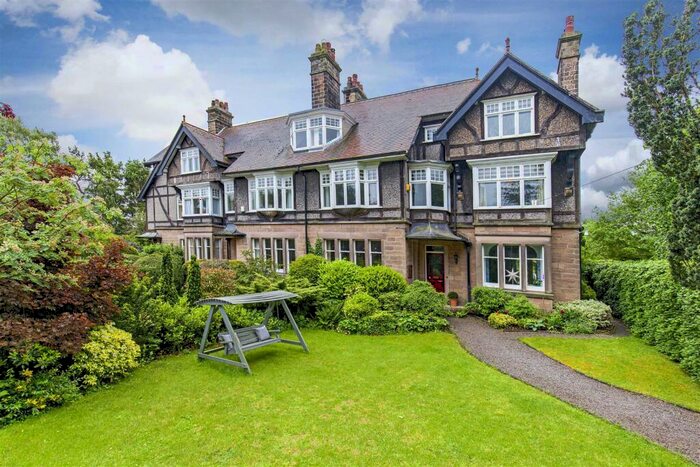
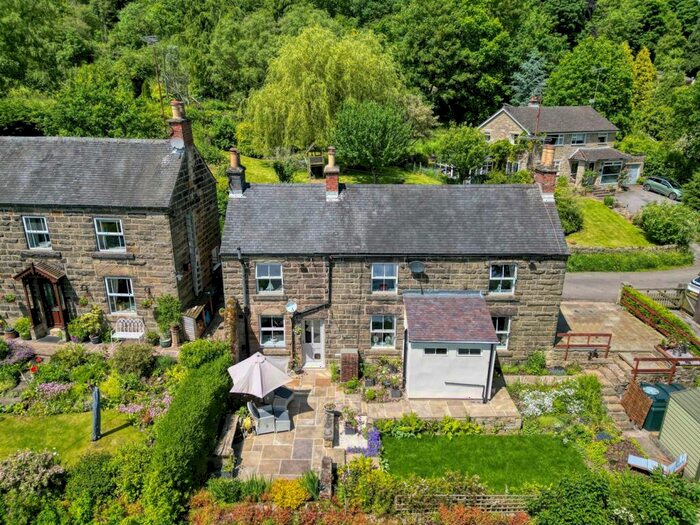
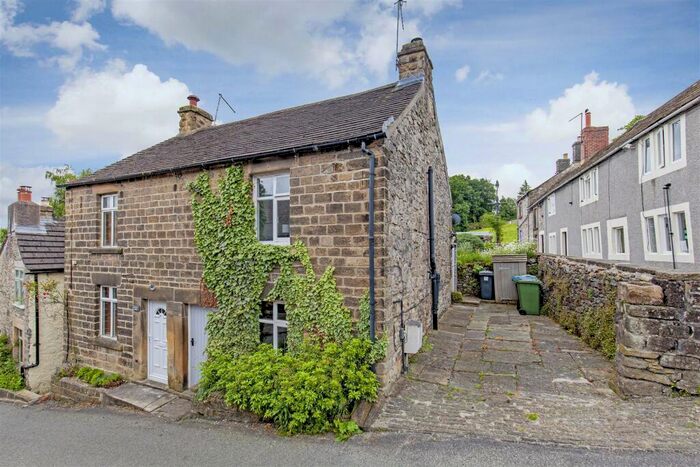
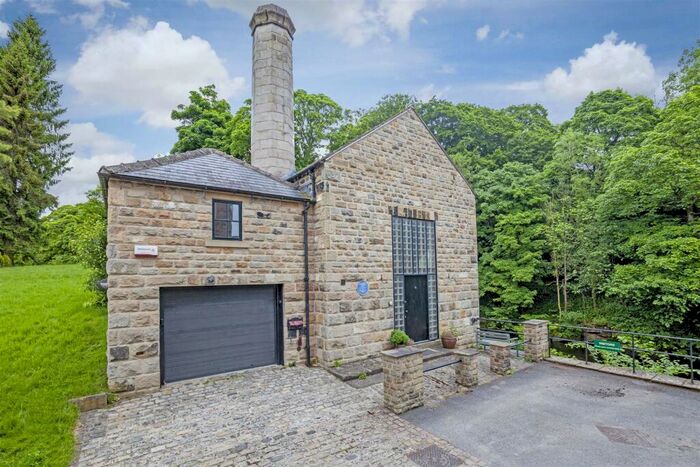
Properties for sale in Bakewell


Neighbourhoods in Bakewell
Navigate through our locations to find the location of your next house in Bakewell, Derbyshire for sale or to rent.
Transport in Bakewell
Please see below transportation links in this area:
-
 Grindleford Station
 -
Matlock Station
-
Hathersage Station
-
Matlock Bath Station
-
Bamford Station
-
Cromford Station
-
Hope (Derbyshire) Station
- FAQ
- Price Paid By Year
- Property Type Price
Frequently asked questions about Bakewell
What is the average price for a property for sale in Bakewell?
The average price for a property for sale in Bakewell is £464,907. This amount is 63% higher than the average price in Derbyshire. There are 1,567 property listings for sale in Bakewell.
What locations have the most expensive properties for sale in Bakewell?
The locations with the most expensive properties for sale in Bakewell are Chatsworth at an average of £658,165 and Litton And Longstone at an average of £556,597.
What locations have the most affordable properties for sale in Bakewell?
The locations with the most affordable properties for sale in Bakewell are Lathkill And Bradford at an average of £345,630 and Bakewell at an average of £430,291.
Which train stations are available in or near Bakewell?
Some of the train stations available in or near Bakewell are Grindleford, Matlock and Hathersage.
Property Price Paid in Bakewell by Year
The average sold property price by year was:
| Year | Average Sold Price | Price Change |
Sold Properties
|
|---|---|---|---|
| 2024 | £388,833 | -21% |
9 Properties |
| 2023 | £468,588 | 2% |
105 Properties |
| 2022 | £458,962 | -3% |
126 Properties |
| 2021 | £471,796 | 11% |
152 Properties |
| 2020 | £421,980 | 8% |
111 Properties |
| 2019 | £386,623 | 4% |
140 Properties |
| 2018 | £370,469 | 7% |
135 Properties |
| 2017 | £343,919 | -4% |
123 Properties |
| 2016 | £356,370 | 10% |
134 Properties |
| 2015 | £322,317 | -1% |
160 Properties |
| 2014 | £326,163 | 2% |
168 Properties |
| 2013 | £319,476 | -5% |
141 Properties |
| 2012 | £334,987 | 6% |
121 Properties |
| 2011 | £314,006 | 3% |
102 Properties |
| 2010 | £304,085 | 4% |
121 Properties |
| 2009 | £292,061 | 1% |
99 Properties |
| 2008 | £287,985 | -16% |
91 Properties |
| 2007 | £335,261 | 7% |
160 Properties |
| 2006 | £310,924 | 1% |
175 Properties |
| 2005 | £307,424 | 20% |
145 Properties |
| 2004 | £247,346 | 14% |
152 Properties |
| 2003 | £212,884 | 12% |
155 Properties |
| 2002 | £187,021 | 16% |
170 Properties |
| 2001 | £156,539 | 11% |
134 Properties |
| 2000 | £139,845 | 19% |
166 Properties |
| 1999 | £113,670 | 10% |
167 Properties |
| 1998 | £102,421 | -2% |
162 Properties |
| 1997 | £104,393 | 15% |
180 Properties |
| 1996 | £88,505 | -8% |
158 Properties |
| 1995 | £95,869 | - |
106 Properties |
Property Price per Property Type in Bakewell
Here you can find historic sold price data in order to help with your property search.
The average Property Paid Price for specific property types in the last three years are:
| Property Type | Average Sold Price | Sold Properties |
|---|---|---|
| Flat | £240,062.00 | 35 Flats |
| Semi Detached House | £377,700.00 | 109 Semi Detached Houses |
| Terraced House | £308,540.00 | 97 Terraced Houses |
| Detached House | £680,421.00 | 151 Detached Houses |