
Houses for sale & to rent in Swadlincote, Derbyshire
House Prices in Swadlincote
Properties in Swadlincote have an average house price of £209,534.00 and had 2,642 Property Transactions within the last 3 years.¹
Swadlincote is an area in Derbyshire with 20,949 households², where the most expensive property was sold for £1,225,000.00.
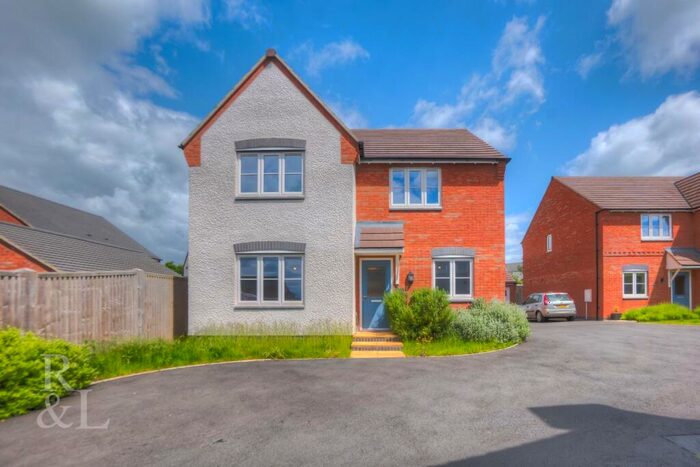
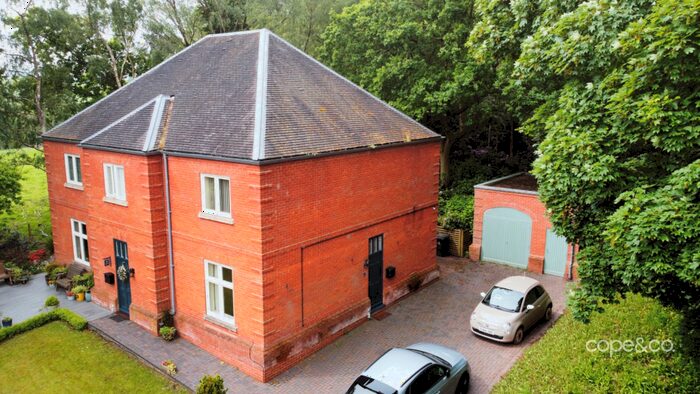
Properties for sale in Swadlincote


Neighbourhoods in Swadlincote
Navigate through our locations to find the location of your next house in Swadlincote, Derbyshire for sale or to rent.
Transport in Swadlincote
Please see below transportation links in this area:
-
 Burton-On-Trent Station
 -
Willington Station
-
Tutbury and Hatton Station
-
Peartree Station
-
Polesworth Station
- FAQ
- Price Paid By Year
- Property Type Price
Frequently asked questions about Swadlincote
What is the average price for a property for sale in Swadlincote?
The average price for a property for sale in Swadlincote is £209,534. This amount is 15% lower than the average price in Derbyshire. There are more than 10,000 property listings for sale in Swadlincote.
What locations have the most expensive properties for sale in Swadlincote?
The locations with the most expensive properties for sale in Swadlincote are Repton at an average of £393,333, Seales at an average of £275,716 and Linton at an average of £243,149.
What locations have the most affordable properties for sale in Swadlincote?
The locations with the most affordable properties for sale in Swadlincote are Newhall And Stanton at an average of £173,312, Church Gresley at an average of £195,987 and Swadlincote at an average of £198,168.
Which train stations are available in or near Swadlincote?
Some of the train stations available in or near Swadlincote are Burton-On-Trent, Willington and Tutbury and Hatton.
Property Price Paid in Swadlincote by Year
The average sold property price by year was:
| Year | Average Sold Price | Price Change |
Sold Properties
|
|---|---|---|---|
| 2024 | £211,616 | 1% |
30 Properties |
| 2023 | £210,040 | -3% |
573 Properties |
| 2022 | £215,564 | 5% |
895 Properties |
| 2021 | £204,508 | 7% |
1,144 Properties |
| 2020 | £190,711 | 2% |
901 Properties |
| 2019 | £185,987 | 3% |
1,073 Properties |
| 2018 | £181,152 | 5% |
1,113 Properties |
| 2017 | £172,436 | 8% |
1,117 Properties |
| 2016 | £159,341 | -0,2% |
1,061 Properties |
| 2015 | £159,698 | 5% |
1,007 Properties |
| 2014 | £151,098 | 8% |
932 Properties |
| 2013 | £139,296 | 1% |
917 Properties |
| 2012 | £137,834 | 4% |
669 Properties |
| 2011 | £132,558 | -5% |
642 Properties |
| 2010 | £139,443 | -0,1% |
628 Properties |
| 2009 | £139,598 | -3% |
537 Properties |
| 2008 | £143,987 | -4% |
739 Properties |
| 2007 | £149,236 | 5% |
1,258 Properties |
| 2006 | £142,507 | 3% |
1,281 Properties |
| 2005 | £138,765 | 7% |
1,155 Properties |
| 2004 | £129,252 | 17% |
1,324 Properties |
| 2003 | £106,713 | 21% |
1,205 Properties |
| 2002 | £83,857 | 21% |
1,499 Properties |
| 2001 | £66,660 | 7% |
1,318 Properties |
| 2000 | £61,851 | 7% |
1,142 Properties |
| 1999 | £57,380 | 12% |
1,014 Properties |
| 1998 | £50,260 | 4% |
902 Properties |
| 1997 | £48,283 | 7% |
809 Properties |
| 1996 | £44,926 | -0,3% |
696 Properties |
| 1995 | £45,064 | - |
612 Properties |
Property Price per Property Type in Swadlincote
Here you can find historic sold price data in order to help with your property search.
The average Property Paid Price for specific property types in the last three years are:
| Property Type | Average Sold Price | Sold Properties |
|---|---|---|
| Terraced House | £152,678.00 | 704 Terraced Houses |
| Flat | £111,106.00 | 67 Flats |
| Semi Detached House | £185,202.00 | 1,024 Semi Detached Houses |
| Detached House | £293,992.00 | 847 Detached Houses |