
Houses for sale & to rent in Okehampton, Devon
House Prices in Okehampton
Properties in Okehampton have an average house price of £314,321.00 and had 886 Property Transactions within the last 3 years.¹
Okehampton is an area in Devon with 7,484 households², where the most expensive property was sold for £4,639,424.00.
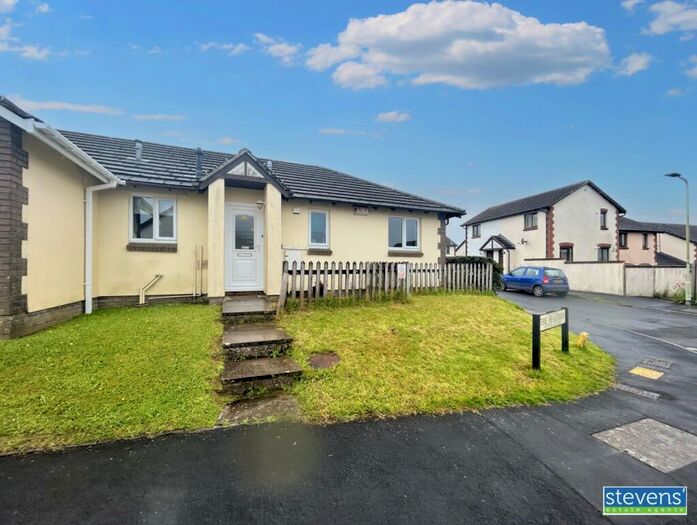
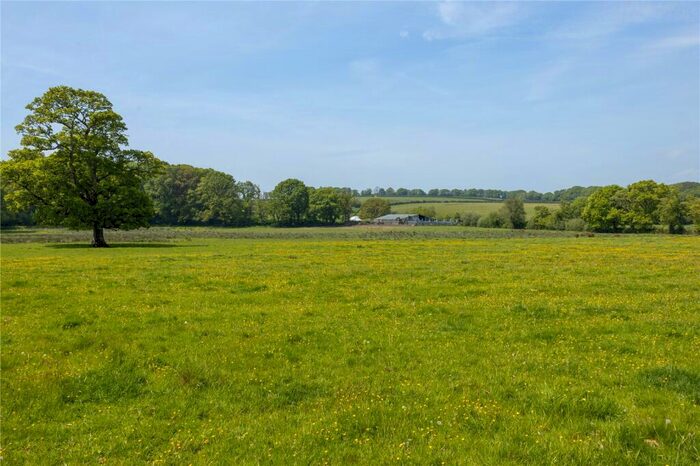
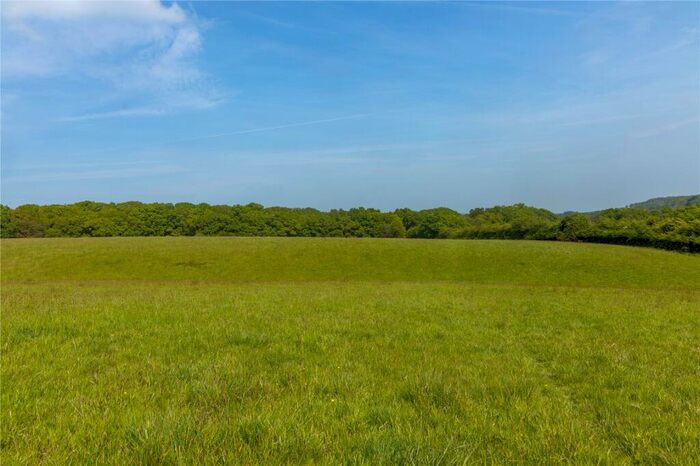
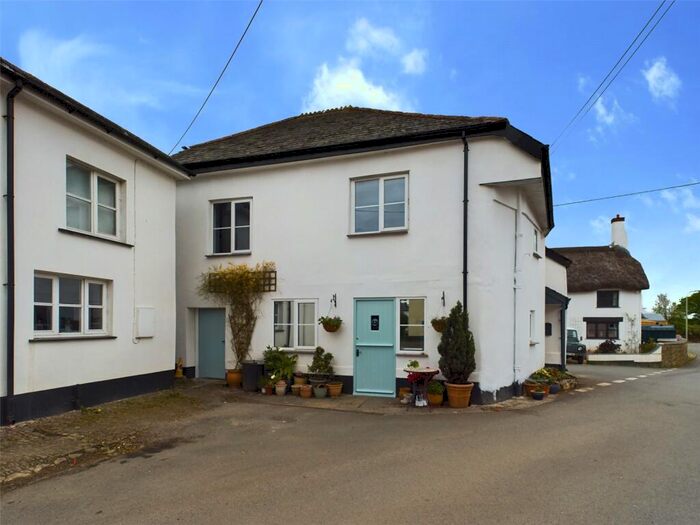
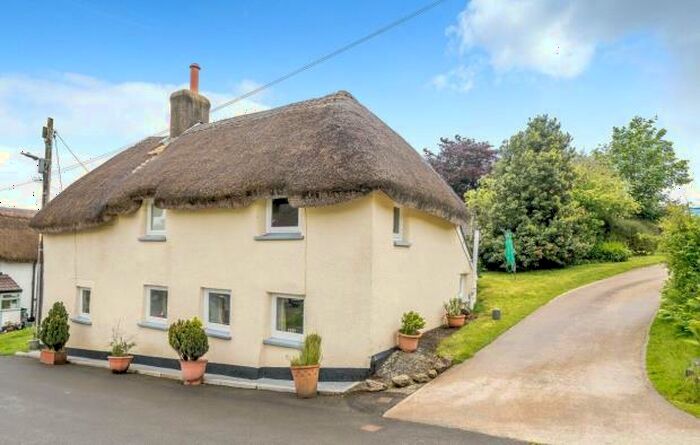
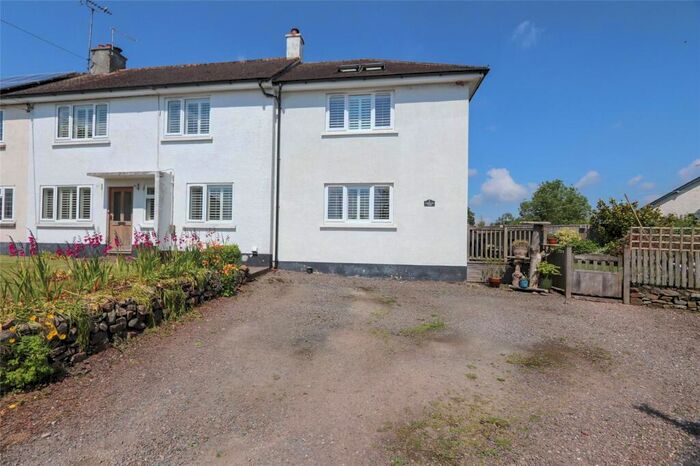
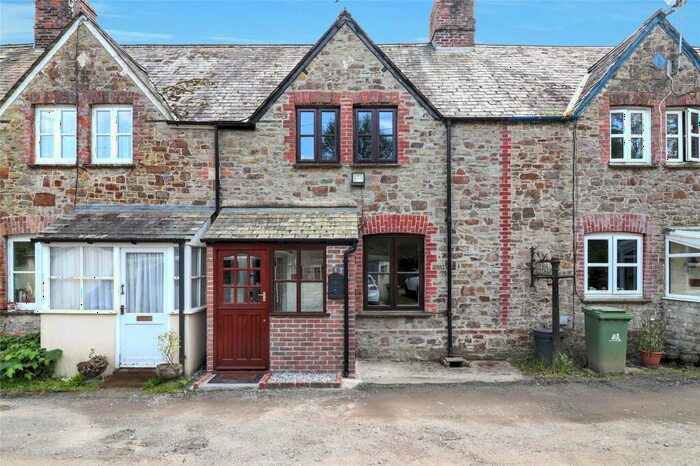
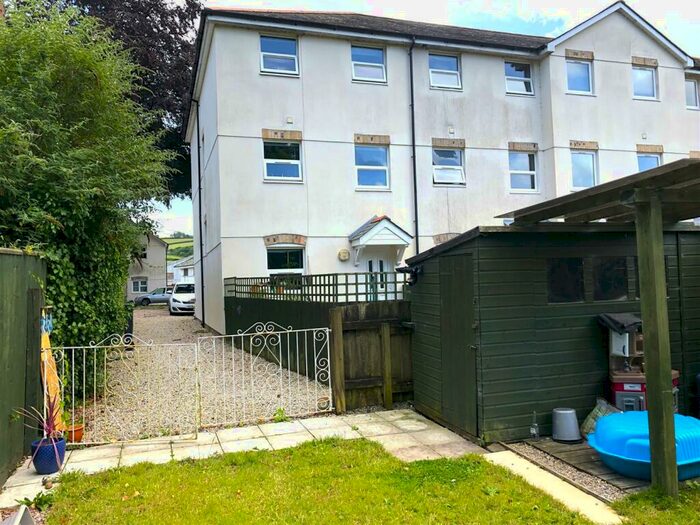
Properties for sale in Okehampton


Neighbourhoods in Okehampton
Navigate through our locations to find the location of your next house in Okehampton, Devon for sale or to rent.
Transport in Okehampton
Please see below transportation links in this area:
-
 Okehampton Station
 -
Sampford Courtenay Station
-
Eggesford Station
-
Lapford Station
-
Morchard Road Station
-
Copplestone Station
-
Yeoford Station
-
King's Nympton Station
- FAQ
- Price Paid By Year
- Property Type Price
Frequently asked questions about Okehampton
What is the average price for a property for sale in Okehampton?
The average price for a property for sale in Okehampton is £314,321. This amount is 13% lower than the average price in Devon. There are 8,102 property listings for sale in Okehampton.
What locations have the most expensive properties for sale in Okehampton?
The locations with the most expensive properties for sale in Okehampton are Thrushel at an average of £513,995, Lydford at an average of £447,026 and Bridestowe at an average of £443,319.
What locations have the most affordable properties for sale in Okehampton?
The locations with the most affordable properties for sale in Okehampton are Okehampton East at an average of £223,054, Okehampton South at an average of £229,285 and Okehampton West at an average of £278,082.
Which train stations are available in or near Okehampton?
Some of the train stations available in or near Okehampton are Okehampton, Sampford Courtenay and Eggesford.
Property Price Paid in Okehampton by Year
The average sold property price by year was:
| Year | Average Sold Price | Price Change |
Sold Properties
|
|---|---|---|---|
| 2024 | £280,990 | -10% |
25 Properties |
| 2023 | £309,895 | -10% |
190 Properties |
| 2022 | £341,016 | 13% |
292 Properties |
| 2021 | £298,172 | 5% |
379 Properties |
| 2020 | £282,417 | 6% |
318 Properties |
| 2019 | £265,521 | -2% |
296 Properties |
| 2018 | £272,153 | 14% |
358 Properties |
| 2017 | £232,980 | -2% |
335 Properties |
| 2016 | £237,041 | 3% |
393 Properties |
| 2015 | £229,830 | 7% |
377 Properties |
| 2014 | £213,849 | -4% |
353 Properties |
| 2013 | £222,691 | 3% |
325 Properties |
| 2012 | £216,156 | 4% |
249 Properties |
| 2011 | £207,980 | -7% |
255 Properties |
| 2010 | £222,178 | 7% |
299 Properties |
| 2009 | £206,783 | -7% |
270 Properties |
| 2008 | £222,244 | -9% |
295 Properties |
| 2007 | £241,255 | 10% |
422 Properties |
| 2006 | £217,817 | -0,2% |
443 Properties |
| 2005 | £218,198 | 13% |
342 Properties |
| 2004 | £190,532 | 17% |
424 Properties |
| 2003 | £157,644 | 6% |
450 Properties |
| 2002 | £148,747 | 27% |
467 Properties |
| 2001 | £109,080 | 5% |
487 Properties |
| 2000 | £103,818 | 12% |
362 Properties |
| 1999 | £90,986 | 17% |
471 Properties |
| 1998 | £75,445 | 8% |
365 Properties |
| 1997 | £69,356 | 8% |
382 Properties |
| 1996 | £63,529 | 1% |
334 Properties |
| 1995 | £62,843 | - |
257 Properties |
Property Price per Property Type in Okehampton
Here you can find historic sold price data in order to help with your property search.
The average Property Paid Price for specific property types in the last three years are:
| Property Type | Average Sold Price | Sold Properties |
|---|---|---|
| Semi Detached House | £263,429.00 | 185 Semi Detached Houses |
| Terraced House | £229,769.00 | 279 Terraced Houses |
| Detached House | £443,607.00 | 348 Detached Houses |
| Flat | £152,346.00 | 74 Flats |