
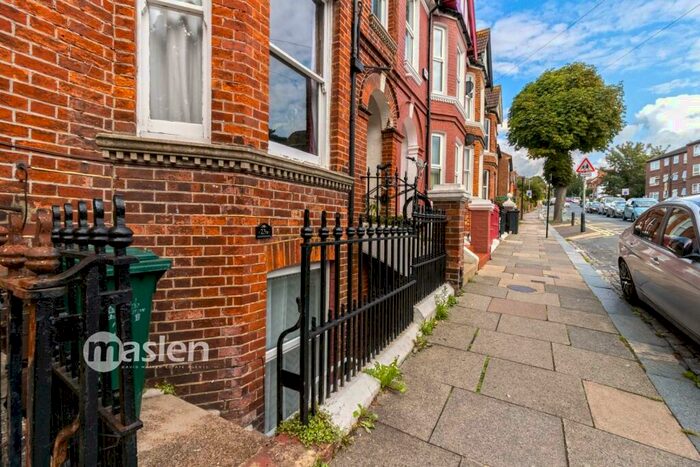
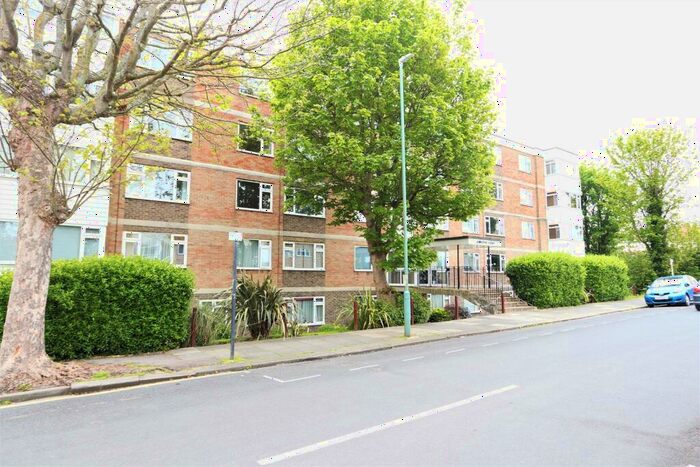
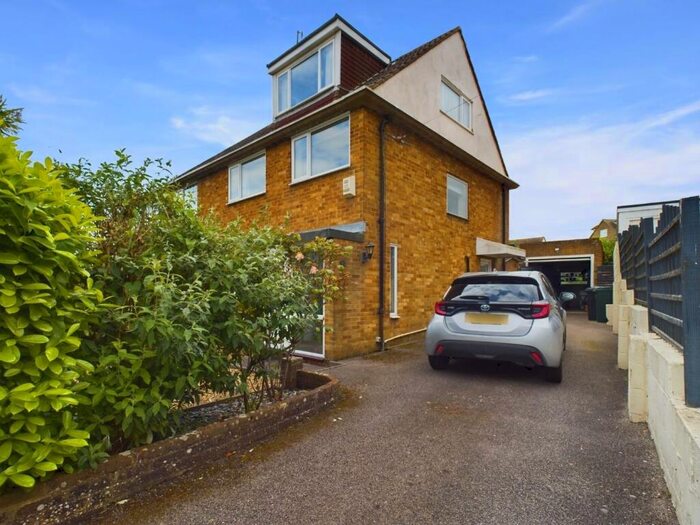
Houses for sale & to rent in Brighton, East Sussex
House Prices in Brighton
Properties in Brighton have an average house price of £418,928.00 and had 205 Property Transactions within the last 3 years.¹
Brighton is an area in East Sussex with 1,664 households², where the most expensive property was sold for £1,050,000.00.
Properties for sale in Brighton


Neighbourhoods in Brighton
Navigate through our locations to find the location of your next house in Brighton, East Sussex for sale or to rent.
- East Saltdean And Telscombe Cliffs
- Kingston
- Ditchling & Westmeston
- East Saltdean & Telscombe Cliffs
- St. Peter's and North Laine
- Queen's Park
- Hollingdean and Stanmer
- Moulsecoomb and Bevendean
- Rottingdean Coastal
- Wish
- South Portslade
- Preston Park
- Regency
- West Hill & North Laine
- Hollingdean & Fiveways
- Patcham & Hollingbury
- Coldean & Stanmer
- Kemptown
- Round Hill
- Moulsecoomb & Bevendean
- Whitehawk & Marina
- Woodingdean
- Rottingdean & West Saltdean
- North Portslade
Transport in Brighton
Please see below transportation links in this area:
-
 Moulsecoomb Station
 -
London Road Brighton Station
-
Brighton Station
-
Preston Park Station
-
Falmer Station
-
Hove Station
- FAQ
- Price Paid By Year
- Property Type Price
Frequently asked questions about Brighton
What is the average price for a property for sale in Brighton?
The average price for a property for sale in Brighton is £418,928. This amount is 7% higher than the average price in East Sussex. There are more than 10,000 property listings for sale in Brighton.
What locations have the most expensive properties for sale in Brighton?
The locations with the most expensive properties for sale in Brighton are Hollingdean and Stanmer at an average of £498,562, East Saltdean And Telscombe Cliffs at an average of £430,464 and Kingston at an average of £400,375.
What locations have the most affordable properties for sale in Brighton?
The locations with the most affordable properties for sale in Brighton are Moulsecoomb and Bevendean at an average of £240,000 and South Portslade at an average of £308,026.
Which train stations are available in or near Brighton?
Some of the train stations available in or near Brighton are Moulsecoomb, London Road Brighton and Brighton.
Property Price Paid in Brighton by Year
The average sold property price by year was:
| Year | Average Sold Price | Price Change |
Sold Properties
|
|---|---|---|---|
| 2024 | £247,500 | -81% |
2 Properties |
| 2023 | £448,368 | 4% |
46 Properties |
| 2022 | £429,710 | 7% |
64 Properties |
| 2021 | £400,634 | 17% |
93 Properties |
| 2020 | £334,225 | -13% |
69 Properties |
| 2019 | £378,717 | -3% |
66 Properties |
| 2018 | £390,794 | 8% |
60 Properties |
| 2017 | £357,642 | 6% |
65 Properties |
| 2016 | £336,510 | 1% |
65 Properties |
| 2015 | £332,300 | 11% |
107 Properties |
| 2014 | £294,741 | 10% |
79 Properties |
| 2013 | £265,413 | 3% |
61 Properties |
| 2012 | £257,598 | 9% |
52 Properties |
| 2011 | £235,701 | -11% |
59 Properties |
| 2010 | £262,224 | 17% |
51 Properties |
| 2009 | £217,152 | -12% |
48 Properties |
| 2008 | £242,296 | -1% |
35 Properties |
| 2007 | £245,276 | 9% |
86 Properties |
| 2006 | £223,440 | 5% |
104 Properties |
| 2005 | £212,990 | 5% |
73 Properties |
| 2004 | £201,991 | 11% |
89 Properties |
| 2003 | £180,762 | 13% |
89 Properties |
| 2002 | £156,433 | 12% |
107 Properties |
| 2001 | £137,803 | 1% |
101 Properties |
| 2000 | £136,887 | 31% |
70 Properties |
| 1999 | £94,637 | 12% |
111 Properties |
| 1998 | £82,871 | 4% |
85 Properties |
| 1997 | £79,763 | 8% |
90 Properties |
| 1996 | £73,022 | 14% |
73 Properties |
| 1995 | £62,469 | - |
65 Properties |
Property Price per Property Type in Brighton
Here you can find historic sold price data in order to help with your property search.
The average Property Paid Price for specific property types in the last three years are:
| Property Type | Average Sold Price | Sold Properties |
|---|---|---|
| Semi Detached House | £440,216.00 | 43 Semi Detached Houses |
| Detached House | £522,712.00 | 94 Detached Houses |
| Flat | £173,079.00 | 46 Flats |
| Terraced House | £447,931.00 | 22 Terraced Houses |