
Houses for sale & to rent in Crowborough, East Sussex
House Prices in Crowborough
Properties in Crowborough have an average house price of £506,179.00 and had 1,361 Property Transactions within the last 3 years.¹
Crowborough is an area in East Sussex with 10,033 households², where the most expensive property was sold for £3,590,000.00.
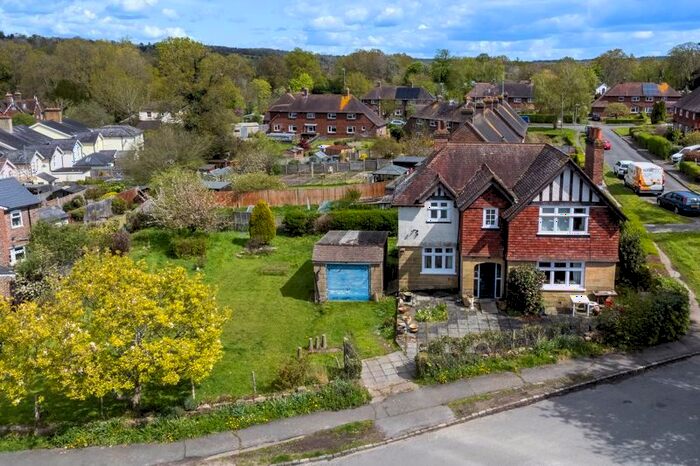
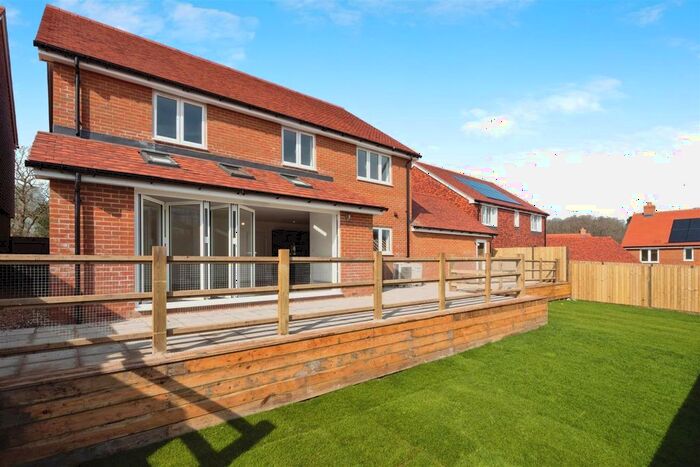
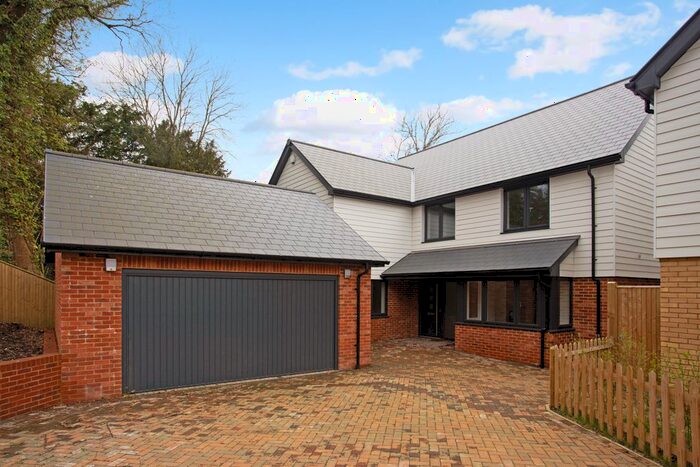
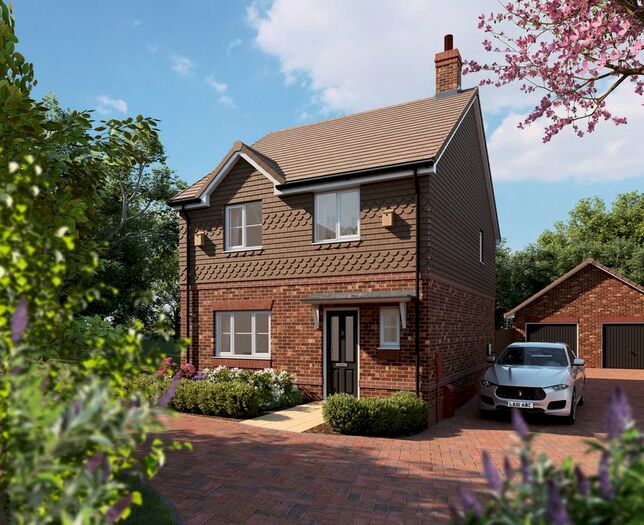
Properties for sale in Crowborough


Neighbourhoods in Crowborough
Navigate through our locations to find the location of your next house in Crowborough, East Sussex for sale or to rent.
- Buxted And Maresfield
- Crowborough East
- Crowborough Jarvis Brook
- Crowborough North
- Crowborough St. Johns
- Crowborough West
- Frant/withyham
- Mayfield
- Rotherfield
- Wadhurst
- Crowborough Central
- Crowborough South East
- Crowborough South West
- Withyham
- Hadlow Down & Rotherfield
- Frant & Wadhurst
- Mayfield & Five Ashes
Transport in Crowborough
Please see below transportation links in this area:

- FAQ
- Price Paid By Year
- Property Type Price
Frequently asked questions about Crowborough
What is the average price for a property for sale in Crowborough?
The average price for a property for sale in Crowborough is £506,179. This amount is 26% higher than the average price in East Sussex. There are 1,875 property listings for sale in Crowborough.
What locations have the most expensive properties for sale in Crowborough?
The locations with the most expensive properties for sale in Crowborough are Buxted And Maresfield at an average of £1,393,500, Frant/withyham at an average of £890,042 and Hadlow Down & Rotherfield at an average of £875,000.
What locations have the most affordable properties for sale in Crowborough?
The locations with the most affordable properties for sale in Crowborough are Crowborough Jarvis Brook at an average of £350,655, Mayfield at an average of £377,500 and Crowborough East at an average of £385,867.
Which train stations are available in or near Crowborough?
Some of the train stations available in or near Crowborough are Crowborough, Eridge and Buxted.
Property Price Paid in Crowborough by Year
The average sold property price by year was:
| Year | Average Sold Price | Price Change |
Sold Properties
|
|---|---|---|---|
| 2024 | £379,071 | -34% |
21 Properties |
| 2023 | £506,883 | -5% |
301 Properties |
| 2022 | £532,072 | 8% |
428 Properties |
| 2021 | £492,062 | 10% |
611 Properties |
| 2020 | £444,503 | 13% |
428 Properties |
| 2019 | £386,159 | -8% |
392 Properties |
| 2018 | £418,400 | 2% |
440 Properties |
| 2017 | £410,672 | 10% |
406 Properties |
| 2016 | £370,394 | 10% |
479 Properties |
| 2015 | £334,544 | -2% |
479 Properties |
| 2014 | £340,253 | 7% |
512 Properties |
| 2013 | £317,362 | -4% |
415 Properties |
| 2012 | £330,276 | 8% |
468 Properties |
| 2011 | £302,846 | -6% |
414 Properties |
| 2010 | £320,389 | 10% |
376 Properties |
| 2009 | £287,742 | 5% |
330 Properties |
| 2008 | £273,712 | -9% |
229 Properties |
| 2007 | £298,488 | 6% |
631 Properties |
| 2006 | £279,621 | 5% |
535 Properties |
| 2005 | £265,758 | 13% |
478 Properties |
| 2004 | £231,907 | 2% |
534 Properties |
| 2003 | £227,969 | 6% |
511 Properties |
| 2002 | £214,553 | 17% |
604 Properties |
| 2001 | £177,233 | 7% |
544 Properties |
| 2000 | £164,741 | 15% |
523 Properties |
| 1999 | £139,787 | 12% |
641 Properties |
| 1998 | £123,636 | 13% |
637 Properties |
| 1997 | £108,136 | 8% |
620 Properties |
| 1996 | £100,007 | -4% |
557 Properties |
| 1995 | £103,618 | - |
423 Properties |
Property Price per Property Type in Crowborough
Here you can find historic sold price data in order to help with your property search.
The average Property Paid Price for specific property types in the last three years are:
| Property Type | Average Sold Price | Sold Properties |
|---|---|---|
| Semi Detached House | £407,741.00 | 330 Semi Detached Houses |
| Terraced House | £317,947.00 | 205 Terraced Houses |
| Detached House | £704,655.00 | 634 Detached Houses |
| Flat | £220,961.00 | 192 Flats |