
Houses for sale & to rent in Etchingham, East Sussex
House Prices in Etchingham
Properties in Etchingham have an average house price of £574,548.00 and had 235 Property Transactions within the last 3 years.¹
Etchingham is an area in East Sussex with 2,033 households², where the most expensive property was sold for £3,510,000.00.
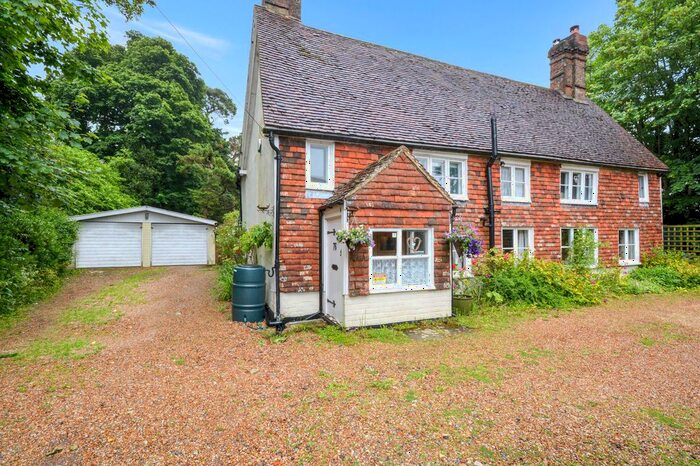
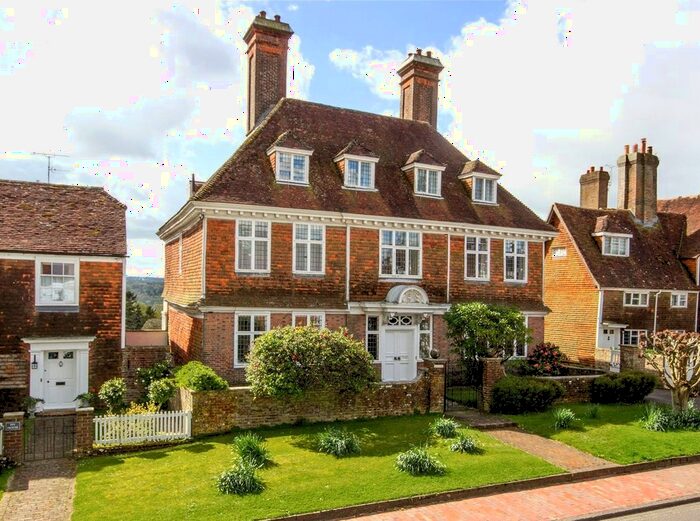
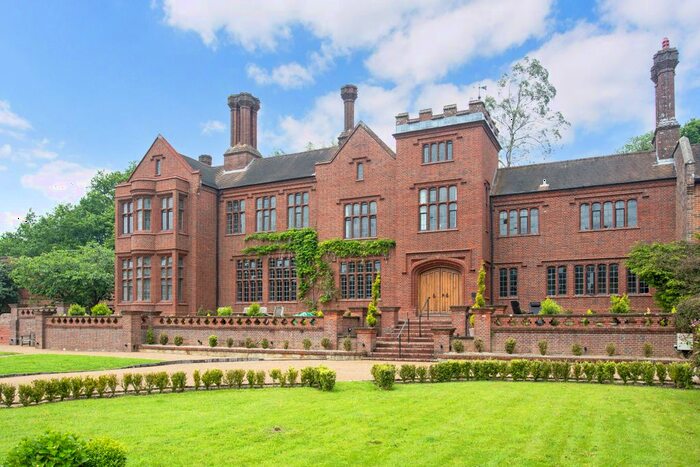
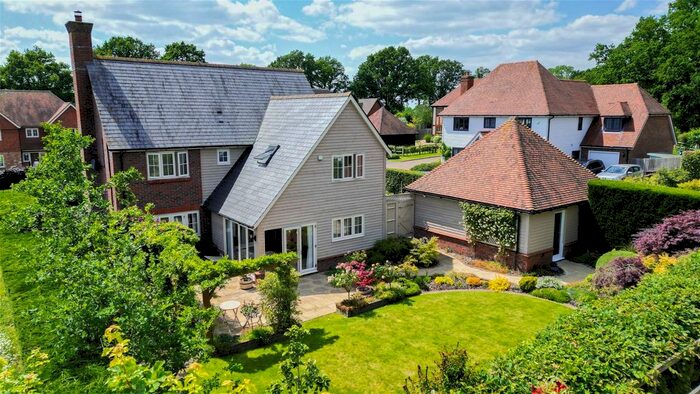
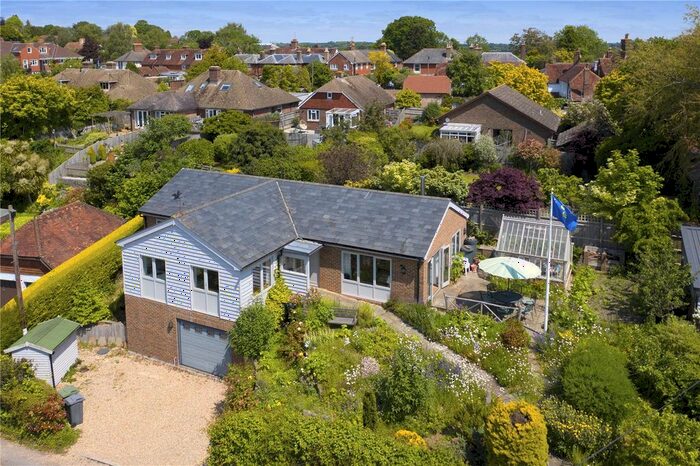
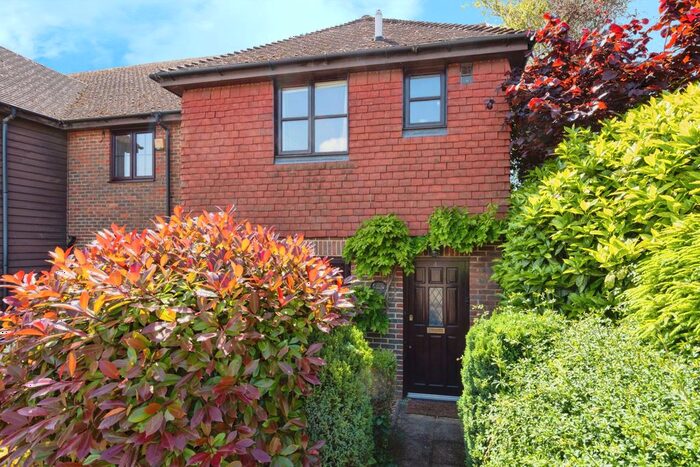
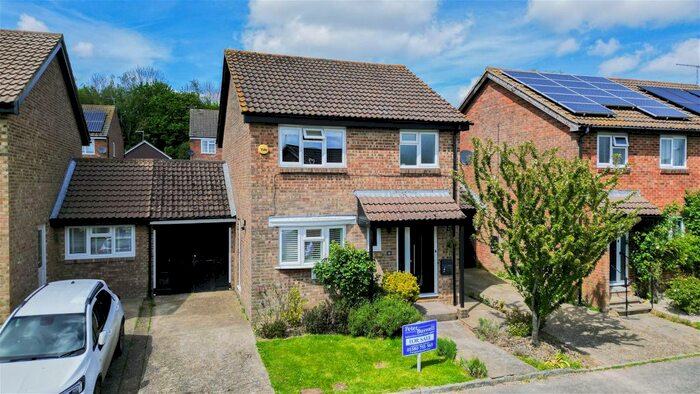
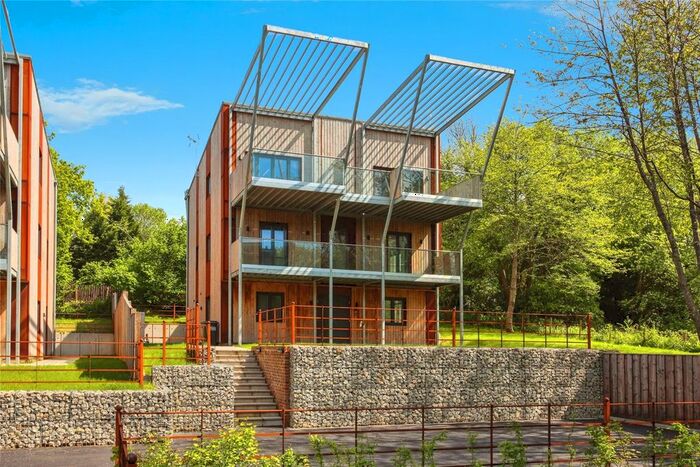
Properties for sale in Etchingham


Neighbourhoods in Etchingham
Navigate through our locations to find the location of your next house in Etchingham, East Sussex for sale or to rent.
Transport in Etchingham
Please see below transportation links in this area:

- FAQ
- Price Paid By Year
- Property Type Price
Frequently asked questions about Etchingham
What is the average price for a property for sale in Etchingham?
The average price for a property for sale in Etchingham is £574,548. This amount is 38% higher than the average price in East Sussex. There are 1,115 property listings for sale in Etchingham.
What locations have the most expensive properties for sale in Etchingham?
The locations with the most expensive properties for sale in Etchingham are Heathfield East at an average of £2,462,000, Ticehurst And Etchingham at an average of £749,272 and Burwash & the Weald at an average of £647,083.
What locations have the most affordable properties for sale in Etchingham?
The locations with the most affordable properties for sale in Etchingham are Salehurst at an average of £389,759 and Darwell at an average of £595,672.
Which train stations are available in or near Etchingham?
Some of the train stations available in or near Etchingham are Etchingham, Stonegate and Robertsbridge.
Property Price Paid in Etchingham by Year
The average sold property price by year was:
| Year | Average Sold Price | Price Change |
Sold Properties
|
|---|---|---|---|
| 2024 | £560,000 | -17% |
2 Properties |
| 2023 | £657,290 | 13% |
48 Properties |
| 2022 | £569,314 | 5% |
75 Properties |
| 2021 | £542,275 | 32% |
110 Properties |
| 2020 | £368,499 | -15% |
67 Properties |
| 2019 | £425,017 | 7% |
89 Properties |
| 2018 | £396,451 | -10% |
74 Properties |
| 2017 | £437,241 | 5% |
64 Properties |
| 2016 | £415,220 | -7% |
89 Properties |
| 2015 | £444,910 | 14% |
123 Properties |
| 2014 | £381,709 | 14% |
96 Properties |
| 2013 | £326,590 | -10% |
91 Properties |
| 2012 | £358,571 | -4% |
73 Properties |
| 2011 | £372,862 | 2% |
57 Properties |
| 2010 | £364,732 | 8% |
64 Properties |
| 2009 | £337,208 | -18% |
55 Properties |
| 2008 | £398,469 | 12% |
62 Properties |
| 2007 | £349,849 | 7% |
107 Properties |
| 2006 | £324,437 | 5% |
113 Properties |
| 2005 | £308,240 | 11% |
89 Properties |
| 2004 | £273,954 | -8% |
108 Properties |
| 2003 | £295,847 | 24% |
97 Properties |
| 2002 | £225,252 | 15% |
112 Properties |
| 2001 | £190,664 | 10% |
109 Properties |
| 2000 | £171,378 | 7% |
97 Properties |
| 1999 | £159,037 | -2% |
133 Properties |
| 1998 | £162,835 | 32% |
116 Properties |
| 1997 | £109,970 | 17% |
105 Properties |
| 1996 | £91,815 | -25% |
91 Properties |
| 1995 | £114,633 | - |
68 Properties |
Property Price per Property Type in Etchingham
Here you can find historic sold price data in order to help with your property search.
The average Property Paid Price for specific property types in the last three years are:
| Property Type | Average Sold Price | Sold Properties |
|---|---|---|
| Flat | £209,206.00 | 24 Flats |
| Semi Detached House | £388,301.00 | 59 Semi Detached Houses |
| Terraced House | £326,579.00 | 44 Terraced Houses |
| Detached House | £858,505.00 | 108 Detached Houses |