
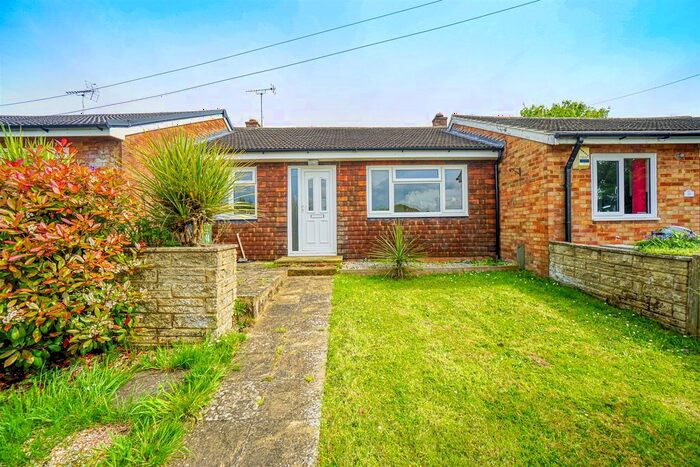
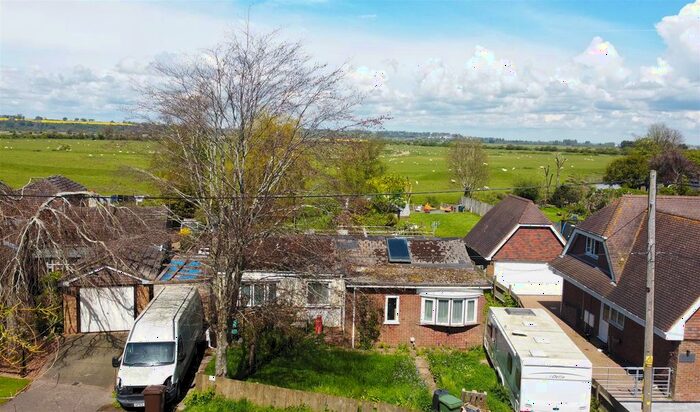
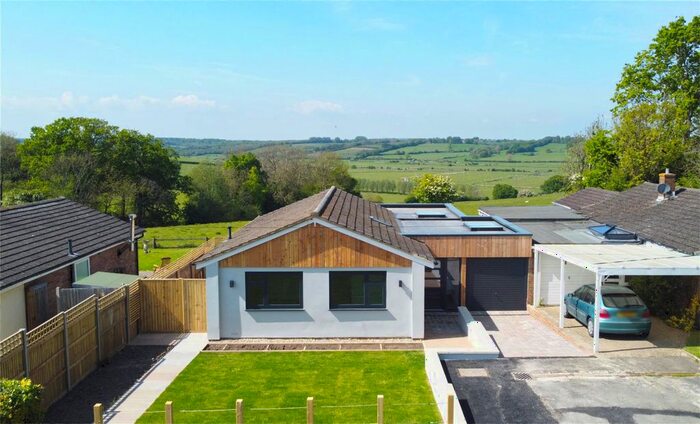
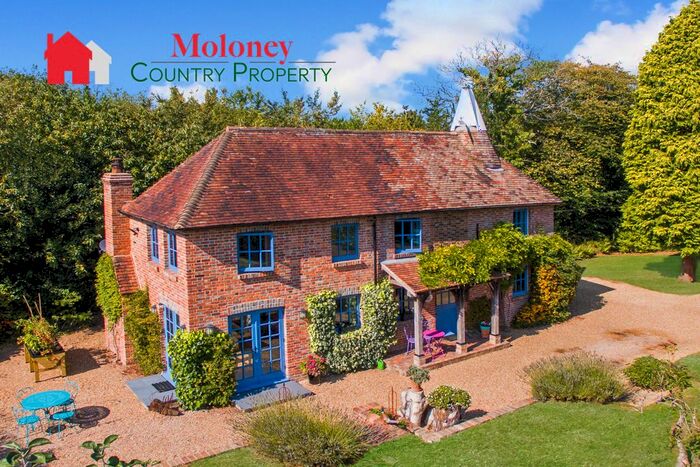
Houses for sale & to rent in Rye, East Sussex
House Prices in Rye
Properties in Rye have an average house price of £457,980.00 and had 819 Property Transactions within the last 3 years.¹
Rye is an area in East Sussex with 6,247 households², where the most expensive property was sold for £1,950,000.00.
Properties for sale in Rye


Neighbourhoods in Rye
Navigate through our locations to find the location of your next house in Rye, East Sussex for sale or to rent.
Transport in Rye
Please see below transportation links in this area:

- FAQ
- Price Paid By Year
- Property Type Price
Frequently asked questions about Rye
What is the average price for a property for sale in Rye?
The average price for a property for sale in Rye is £457,980. This amount is 16% higher than the average price in East Sussex. There are 4,687 property listings for sale in Rye.
What locations have the most expensive properties for sale in Rye?
The locations with the most expensive properties for sale in Rye are Brede Valley at an average of £531,055, Rother Levels at an average of £513,814 and Northern Rother at an average of £445,500.
What locations have the most affordable properties for sale in Rye?
The locations with the most affordable properties for sale in Rye are Rye & Winchelsea at an average of £368,636, Eastern Rother at an average of £407,465 and Rye at an average of £419,704.
Which train stations are available in or near Rye?
Some of the train stations available in or near Rye are Rye, Winchelsea and Doleham.
Property Price Paid in Rye by Year
The average sold property price by year was:
| Year | Average Sold Price | Price Change |
Sold Properties
|
|---|---|---|---|
| 2024 | £575,755 | 21% |
15 Properties |
| 2023 | £456,360 | -4% |
186 Properties |
| 2022 | £474,214 | 7% |
281 Properties |
| 2021 | £440,095 | 4% |
337 Properties |
| 2020 | £420,390 | 11% |
259 Properties |
| 2019 | £372,857 | -3% |
228 Properties |
| 2018 | £385,095 | 8% |
304 Properties |
| 2017 | £353,924 | 8% |
334 Properties |
| 2016 | £324,055 | -0,5% |
342 Properties |
| 2015 | £325,526 | 7% |
371 Properties |
| 2014 | £302,940 | 2% |
344 Properties |
| 2013 | £296,315 | 5% |
290 Properties |
| 2012 | £281,602 | 5% |
271 Properties |
| 2011 | £267,945 | -6% |
225 Properties |
| 2010 | £285,083 | 5% |
240 Properties |
| 2009 | £271,370 | -4% |
219 Properties |
| 2008 | £280,955 | 1% |
208 Properties |
| 2007 | £277,625 | 7% |
396 Properties |
| 2006 | £259,145 | 5% |
360 Properties |
| 2005 | £246,350 | 4% |
295 Properties |
| 2004 | £236,013 | 10% |
291 Properties |
| 2003 | £211,526 | 17% |
321 Properties |
| 2002 | £174,831 | 17% |
373 Properties |
| 2001 | £145,868 | 1% |
312 Properties |
| 2000 | £145,006 | 25% |
323 Properties |
| 1999 | £108,447 | 3% |
387 Properties |
| 1998 | £105,571 | 8% |
356 Properties |
| 1997 | £97,131 | 17% |
435 Properties |
| 1996 | £80,461 | 8% |
346 Properties |
| 1995 | £74,345 | - |
261 Properties |
Property Price per Property Type in Rye
Here you can find historic sold price data in order to help with your property search.
The average Property Paid Price for specific property types in the last three years are:
| Property Type | Average Sold Price | Sold Properties |
|---|---|---|
| Semi Detached House | £401,172.00 | 190 Semi Detached Houses |
| Terraced House | £391,504.00 | 203 Terraced Houses |
| Detached House | £598,593.00 | 335 Detached Houses |
| Flat | £207,240.00 | 91 Flats |