
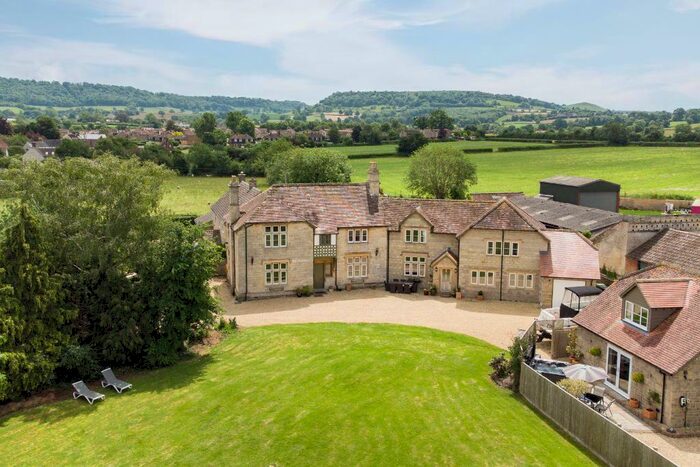
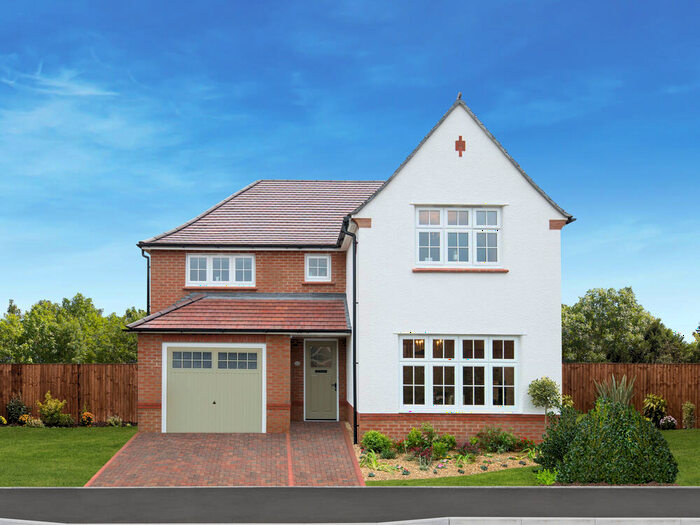
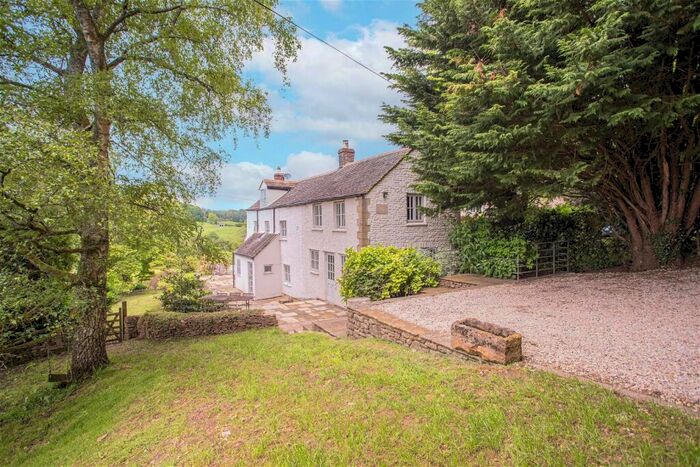
Houses for sale & to rent in Dursley, Gloucestershire
House Prices in Dursley
Properties in Dursley have an average house price of £336,976.00 and had 1,011 Property Transactions within the last 3 years.¹
Dursley is an area in Gloucestershire with 7,824 households², where the most expensive property was sold for £7,825,000.00.
Properties for sale in Dursley


Neighbourhoods in Dursley
Navigate through our locations to find the location of your next house in Dursley, Gloucestershire for sale or to rent.
Transport in Dursley
Please see below transportation links in this area:

- FAQ
- Price Paid By Year
- Property Type Price
Frequently asked questions about Dursley
What is the average price for a property for sale in Dursley?
The average price for a property for sale in Dursley is £336,976. This amount is 8% lower than the average price in Gloucestershire. There are 4,974 property listings for sale in Dursley.
What locations have the most expensive properties for sale in Dursley?
The locations with the most expensive properties for sale in Dursley are Coaley And Uley at an average of £610,002, Wotton-under-edge at an average of £575,606 and Vale at an average of £540,837.
What locations have the most affordable properties for sale in Dursley?
The locations with the most affordable properties for sale in Dursley are Dursley at an average of £271,468, Cam East at an average of £329,183 and Cam West at an average of £331,708.
Which train stations are available in or near Dursley?
Some of the train stations available in or near Dursley are Cam and Dursley, Stonehouse and Stroud.
Property Price Paid in Dursley by Year
The average sold property price by year was:
| Year | Average Sold Price | Price Change |
Sold Properties
|
|---|---|---|---|
| 2024 | £452,144 | 16% |
13 Properties |
| 2023 | £378,143 | 17% |
220 Properties |
| 2022 | £315,690 | -4% |
297 Properties |
| 2021 | £328,179 | 2% |
481 Properties |
| 2020 | £321,133 | 11% |
352 Properties |
| 2019 | £287,212 | 2% |
398 Properties |
| 2018 | £281,183 | 4% |
384 Properties |
| 2017 | £269,501 | 9% |
334 Properties |
| 2016 | £246,418 | 5% |
367 Properties |
| 2015 | £234,730 | 11% |
354 Properties |
| 2014 | £208,645 | -2% |
356 Properties |
| 2013 | £213,243 | 8% |
285 Properties |
| 2012 | £196,839 | -6% |
242 Properties |
| 2011 | £209,430 | -2% |
268 Properties |
| 2010 | £214,189 | 13% |
244 Properties |
| 2009 | £186,975 | -12% |
214 Properties |
| 2008 | £209,892 | -2% |
246 Properties |
| 2007 | £214,641 | 7% |
386 Properties |
| 2006 | £199,629 | 4% |
444 Properties |
| 2005 | £191,754 | -0,4% |
271 Properties |
| 2004 | £192,512 | 14% |
295 Properties |
| 2003 | £164,908 | 14% |
359 Properties |
| 2002 | £142,391 | 16% |
405 Properties |
| 2001 | £119,116 | 14% |
375 Properties |
| 2000 | £102,716 | 11% |
311 Properties |
| 1999 | £91,878 | 12% |
370 Properties |
| 1998 | £81,186 | 12% |
305 Properties |
| 1997 | £71,192 | 1% |
351 Properties |
| 1996 | £70,607 | 12% |
289 Properties |
| 1995 | £62,058 | - |
229 Properties |
Property Price per Property Type in Dursley
Here you can find historic sold price data in order to help with your property search.
The average Property Paid Price for specific property types in the last three years are:
| Property Type | Average Sold Price | Sold Properties |
|---|---|---|
| Semi Detached House | £290,520.00 | 327 Semi Detached Houses |
| Terraced House | £248,995.00 | 214 Terraced Houses |
| Detached House | £478,624.00 | 380 Detached Houses |
| Flat | £116,901.00 | 90 Flats |