
Houses for sale & to rent in Moreton-in-marsh, Gloucestershire
House Prices in Moreton-in-marsh
Properties in Moreton-in-marsh have an average house price of £516,578.00 and had 575 Property Transactions within the last 3 years.¹
Moreton-in-marsh is an area in Gloucestershire with 3,558 households², where the most expensive property was sold for £6,500,000.00.
Properties for sale in Moreton-in-marsh


Neighbourhoods in Moreton-in-marsh
Navigate through our locations to find the location of your next house in Moreton-in-marsh, Gloucestershire for sale or to rent.
Transport in Moreton-in-marsh
Please see below transportation links in this area:

- FAQ
- Price Paid By Year
- Property Type Price
Frequently asked questions about Moreton-in-marsh
What is the average price for a property for sale in Moreton-in-marsh?
The average price for a property for sale in Moreton-in-marsh is £516,578. This amount is 35% higher than the average price in Gloucestershire. There are 1,915 property listings for sale in Moreton-in-marsh.
What locations have the most expensive properties for sale in Moreton-in-marsh?
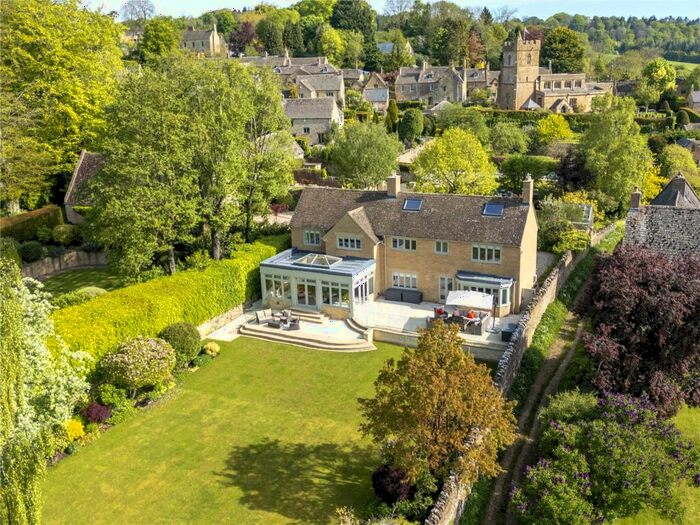
The locations with the most expensive properties for sale in Moreton-in-marsh are Beacon-stow at an average of £1,156,713, Fosseridge at an average of £719,123 and Blockley at an average of £549,112.
What locations have the most affordable properties for sale in Moreton-in-marsh?
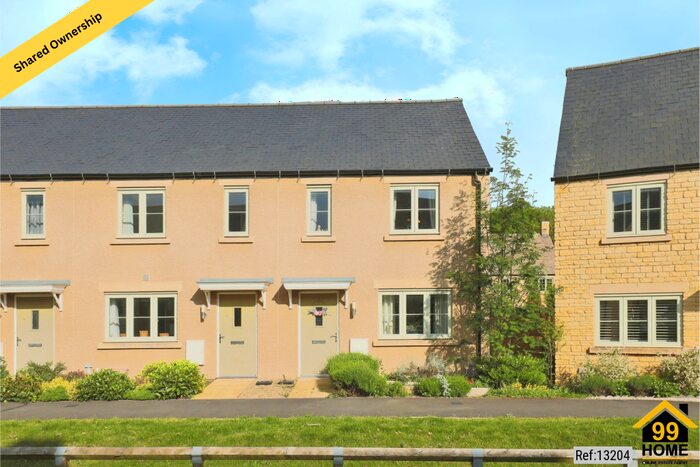
The locations with the most affordable properties for sale in Moreton-in-marsh are Moreton West at an average of £286,897, Moreton East at an average of £344,990 and Moreton-in-marsh at an average of £384,429.
Which train stations are available in or near Moreton-in-marsh?
Some of the train stations available in or near Moreton-in-marsh are Moreton-In-Marsh, Kingham and Honeybourne.
Property Price Paid in Moreton-in-marsh by Year
The average sold property price by year was:
| Year | Average Sold Price | Price Change |
Sold Properties
|
|---|---|---|---|
| 2024 | £612,816 | 21% |
13 Properties |
| 2023 | £487,004 | -20% |
136 Properties |
| 2022 | £584,582 | 19% |
194 Properties |
| 2021 | £471,656 | -8% |
232 Properties |
| 2020 | £509,893 | 20% |
192 Properties |
| 2019 | £407,365 | 8% |
187 Properties |
| 2018 | £373,685 | -8% |
229 Properties |
| 2017 | £403,028 | 13% |
265 Properties |
| 2016 | £350,946 | 5% |
213 Properties |
| 2015 | £334,233 | 1% |
221 Properties |
| 2014 | £330,696 | 1% |
265 Properties |
| 2013 | £327,057 | -4% |
181 Properties |
| 2012 | £338,758 | -16% |
162 Properties |
| 2011 | £392,266 | 14% |
145 Properties |
| 2010 | £338,281 | 12% |
155 Properties |
| 2009 | £297,851 | -2% |
177 Properties |
| 2008 | £303,806 | -1% |
148 Properties |
| 2007 | £307,490 | -6% |
167 Properties |
| 2006 | £324,782 | 12% |
224 Properties |
| 2005 | £287,009 | 10% |
212 Properties |
| 2004 | £258,949 | -4% |
211 Properties |
| 2003 | £269,654 | 11% |
173 Properties |
| 2002 | £240,694 | 21% |
204 Properties |
| 2001 | £191,222 | 11% |
166 Properties |
| 2000 | £169,790 | 3% |
174 Properties |
| 1999 | £165,450 | 14% |
171 Properties |
| 1998 | £143,037 | 16% |
136 Properties |
| 1997 | £120,855 | 17% |
209 Properties |
| 1996 | £100,633 | -12% |
182 Properties |
| 1995 | £113,206 | - |
173 Properties |
Property Price per Property Type in Moreton-in-marsh
Here you can find historic sold price data in order to help with your property search.
The average Property Paid Price for specific property types in the last three years are:
| Property Type | Average Sold Price | Sold Properties |
|---|---|---|
| Semi Detached House | £411,569.00 | 158 Semi Detached Houses |
| Terraced House | £386,255.00 | 164 Terraced Houses |
| Detached House | £833,747.00 | 181 Detached Houses |
| Flat | £246,530.00 | 72 Flats |