
Houses for sale & to rent in New Milton, Hampshire
House Prices in New Milton
Properties in New Milton have an average house price of £452,322.00 and had 1,552 Property Transactions within the last 3 years.¹
New Milton is an area in Hampshire with 11,946 households², where the most expensive property was sold for £2,700,000.00.
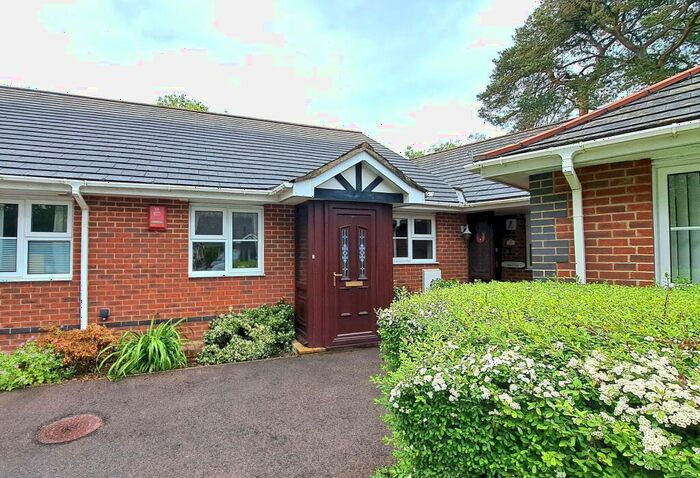
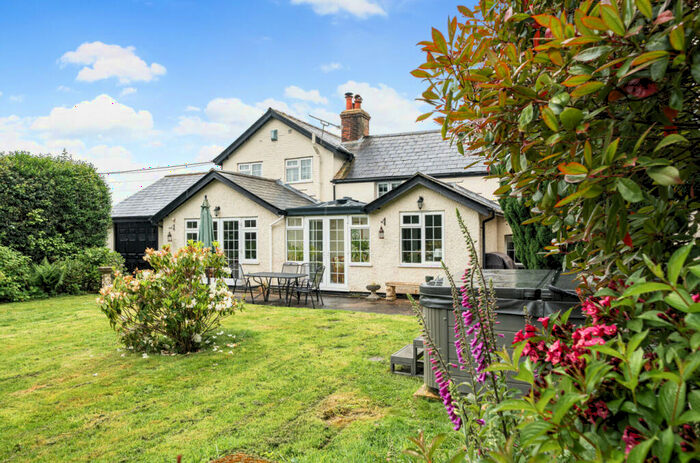
Properties for sale in New Milton


Neighbourhoods in New Milton
Navigate through our locations to find the location of your next house in New Milton, Hampshire for sale or to rent.
Transport in New Milton
Please see below transportation links in this area:

- FAQ
- Price Paid By Year
- Property Type Price
Frequently asked questions about New Milton
What is the average price for a property for sale in New Milton?
The average price for a property for sale in New Milton is £452,322. This amount is 8% higher than the average price in Hampshire. There are 7,122 property listings for sale in New Milton.
What locations have the most expensive properties for sale in New Milton?
The locations with the most expensive properties for sale in New Milton are Brockenhurst And Forest South East at an average of £1,198,000, Bashley at an average of £539,492 and Becton at an average of £524,858.
What locations have the most affordable properties for sale in New Milton?
The locations with the most affordable properties for sale in New Milton are Milton at an average of £330,933, Fernhill at an average of £409,116 and Barton at an average of £524,275.
Which train stations are available in or near New Milton?
Some of the train stations available in or near New Milton are New Milton, Hinton Admiral and Sway.
Property Price Paid in New Milton by Year
The average sold property price by year was:
| Year | Average Sold Price | Price Change |
Sold Properties
|
|---|---|---|---|
| 2024 | £339,571 | -39% |
21 Properties |
| 2023 | £471,460 | 1% |
340 Properties |
| 2022 | £465,140 | 6% |
461 Properties |
| 2021 | £438,558 | 13% |
730 Properties |
| 2020 | £381,289 | 5% |
492 Properties |
| 2019 | £362,111 | 4% |
495 Properties |
| 2018 | £345,941 | -4% |
580 Properties |
| 2017 | £358,991 | 9% |
566 Properties |
| 2016 | £327,130 | 4% |
636 Properties |
| 2015 | £315,623 | 7% |
696 Properties |
| 2014 | £294,982 | 6% |
641 Properties |
| 2013 | £275,897 | -0,1% |
596 Properties |
| 2012 | £276,145 | 2% |
441 Properties |
| 2011 | £269,336 | 4% |
435 Properties |
| 2010 | £257,427 | 10% |
495 Properties |
| 2009 | £232,343 | -16% |
561 Properties |
| 2008 | £269,796 | -1% |
392 Properties |
| 2007 | £273,736 | 7% |
766 Properties |
| 2006 | £255,845 | 9% |
838 Properties |
| 2005 | £233,759 | -2% |
645 Properties |
| 2004 | £239,535 | 13% |
692 Properties |
| 2003 | £207,855 | 12% |
728 Properties |
| 2002 | £183,327 | 16% |
914 Properties |
| 2001 | £154,168 | 14% |
763 Properties |
| 2000 | £132,905 | 13% |
765 Properties |
| 1999 | £115,071 | 9% |
972 Properties |
| 1998 | £104,264 | 13% |
689 Properties |
| 1997 | £91,186 | 5% |
893 Properties |
| 1996 | £86,860 | 7% |
817 Properties |
| 1995 | £80,992 | - |
595 Properties |
Property Price per Property Type in New Milton
Here you can find historic sold price data in order to help with your property search.
The average Property Paid Price for specific property types in the last three years are:
| Property Type | Average Sold Price | Sold Properties |
|---|---|---|
| Semi Detached House | £388,887.00 | 178 Semi Detached Houses |
| Terraced House | £332,771.00 | 234 Terraced Houses |
| Detached House | £614,607.00 | 760 Detached Houses |
| Flat | £231,087.00 | 380 Flats |