
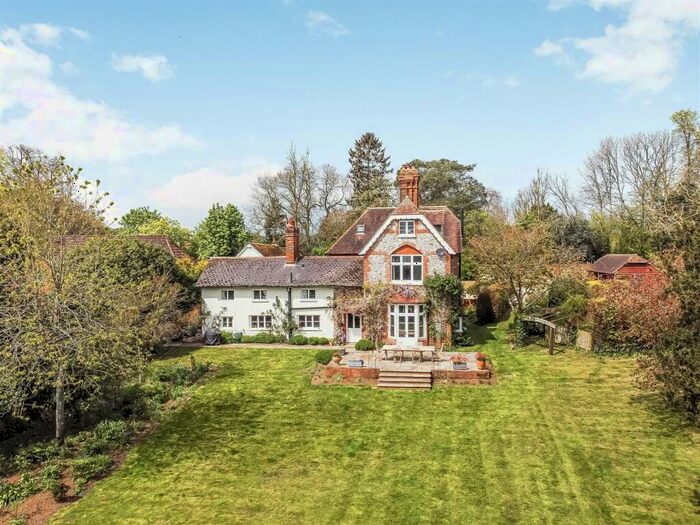
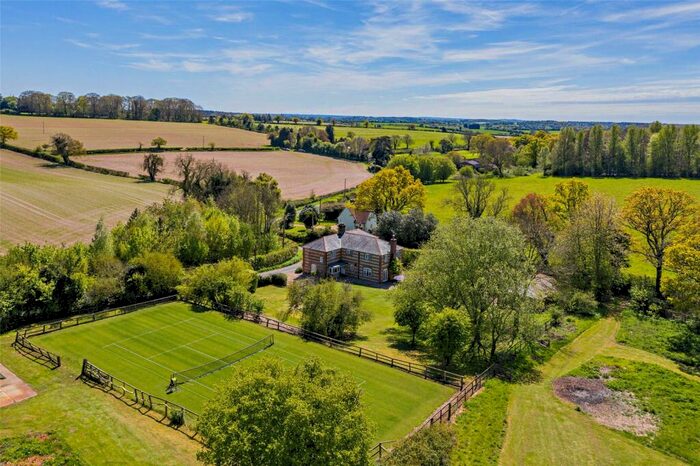
Houses for sale & to rent in Whitchurch, Hampshire
House Prices in Whitchurch
Properties in Whitchurch have an average house price of £410,185.00 and had 282 Property Transactions within the last 3 years.¹
Whitchurch is an area in Hampshire with 2,457 households², where the most expensive property was sold for £1,235,000.00.
Properties for sale in Whitchurch


Neighbourhoods in Whitchurch
Navigate through our locations to find the location of your next house in Whitchurch, Hampshire for sale or to rent.
Transport in Whitchurch
Please see below transportation links in this area:

- FAQ
- Price Paid By Year
- Property Type Price
Frequently asked questions about Whitchurch
What is the average price for a property for sale in Whitchurch?
The average price for a property for sale in Whitchurch is £410,185. This amount is 2% lower than the average price in Hampshire. There are 721 property listings for sale in Whitchurch.
What locations have the most expensive properties for sale in Whitchurch?
The locations with the most expensive properties for sale in Whitchurch are Evingar at an average of £800,000, Burghclere, Highclere And St Mary Bourne at an average of £632,500 and Overton, Laverstoke And Steventon at an average of £568,583.
What locations have the most affordable properties for sale in Whitchurch?
The locations with the most affordable properties for sale in Whitchurch are Whitchurch at an average of £393,976 and Whitchurch, Overton & Laverstoke at an average of £442,242.
Which train stations are available in or near Whitchurch?
Some of the train stations available in or near Whitchurch are Whitchurch (Hampshire), Overton and Micheldever.
Property Price Paid in Whitchurch by Year
The average sold property price by year was:
| Year | Average Sold Price | Price Change |
Sold Properties
|
|---|---|---|---|
| 2024 | £469,000 | 13% |
6 Properties |
| 2023 | £408,629 | 2% |
77 Properties |
| 2022 | £399,928 | -4% |
88 Properties |
| 2021 | £416,218 | 3% |
111 Properties |
| 2020 | £405,722 | 3% |
99 Properties |
| 2019 | £391,755 | 6% |
136 Properties |
| 2018 | £369,473 | -3% |
138 Properties |
| 2017 | £378,999 | 7% |
90 Properties |
| 2016 | £353,838 | 12% |
105 Properties |
| 2015 | £311,093 | 1% |
105 Properties |
| 2014 | £308,565 | 3% |
108 Properties |
| 2013 | £299,549 | -1% |
69 Properties |
| 2012 | £302,830 | 11% |
80 Properties |
| 2011 | £268,237 | -2% |
62 Properties |
| 2010 | £273,442 | 6% |
62 Properties |
| 2009 | £257,283 | -3% |
113 Properties |
| 2008 | £266,002 | 3% |
77 Properties |
| 2007 | £258,016 | 1% |
122 Properties |
| 2006 | £255,230 | 4% |
139 Properties |
| 2005 | £245,225 | 5% |
103 Properties |
| 2004 | £231,791 | -4% |
129 Properties |
| 2003 | £240,089 | 17% |
102 Properties |
| 2002 | £199,791 | 19% |
135 Properties |
| 2001 | £162,190 | 5% |
110 Properties |
| 2000 | £154,387 | -1% |
125 Properties |
| 1999 | £156,455 | 21% |
178 Properties |
| 1998 | £123,809 | 27% |
129 Properties |
| 1997 | £90,145 | -15% |
130 Properties |
| 1996 | £103,395 | 18% |
105 Properties |
| 1995 | £84,524 | - |
84 Properties |
Property Price per Property Type in Whitchurch
Here you can find historic sold price data in order to help with your property search.
The average Property Paid Price for specific property types in the last three years are:
| Property Type | Average Sold Price | Sold Properties |
|---|---|---|
| Flat | £168,114.00 | 28 Flats |
| Semi Detached House | £395,328.00 | 76 Semi Detached Houses |
| Terraced House | £336,909.00 | 100 Terraced Houses |
| Detached House | £605,503.00 | 78 Detached Houses |