
Houses for sale & to rent in Rainham, Havering London Borough
House Prices in Rainham
Properties in this part of Rainham within the Havering London Borough have an average house price of £389,698.00 and had 1,297 Property Transactions within the last 3 years.¹ This area has 11,496 households² , where the most expensive property was sold for £1,230,000.00.
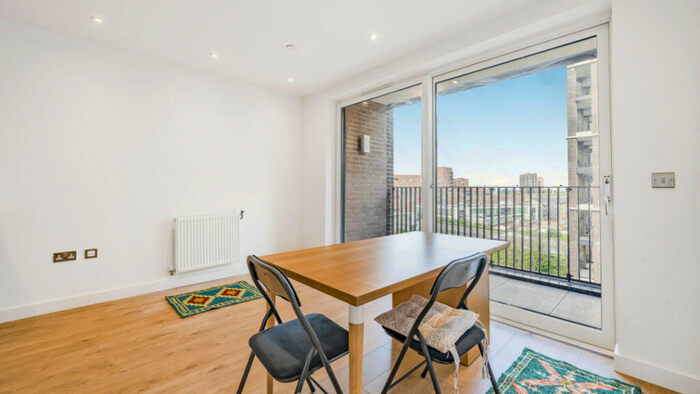
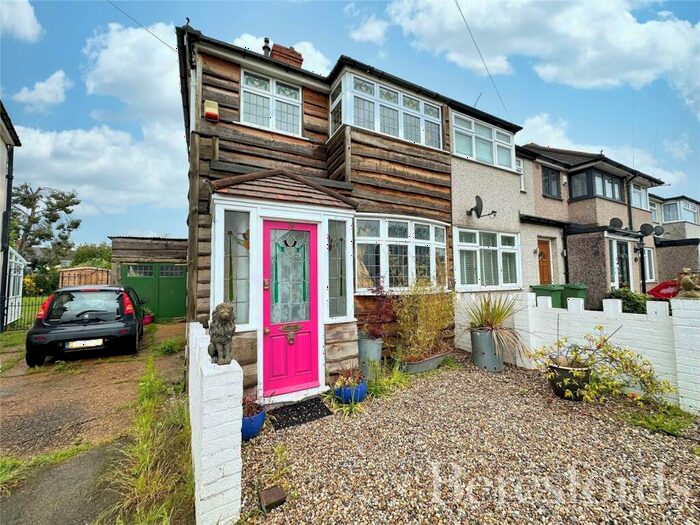
Properties for sale in Rainham


Neighbourhoods in Rainham
Navigate through our locations to find the location of your next house in Rainham, Havering London Borough for sale or to rent.
Transport in Rainham
Please see below transportation links in this area:
-
 Rainham Station
 -
Rainham (Essex) Station
-
 Elm Park Station
 -
Dagenham East Station
-
Dagenham Dock Station
-
Dagenham Heathway Station
-
Hornchurch Station
-
Upminster Bridge Station
-
Belvedere Station
- FAQ
- Price Paid By Year
- Property Type Price
Frequently asked questions about Rainham
What is the average price for a property for sale in Rainham?
The average price for a property for sale in Rainham is £389,698. This amount is 13% lower than the average price in Havering London Borough. There are 6,145 property listings for sale in Rainham.
What locations have the most expensive properties for sale in Rainham?
The locations with the most expensive properties for sale in Rainham are Rainham And Wennington at an average of £397,179 and South Hornchurch at an average of £384,510.
What locations have the most affordable properties for sale in Rainham?
The location with the most affordable properties for sale in Rainham is Elm Park at an average of £383,361.
Which train stations are available in or near Rainham?
Some of the train stations available in or near Rainham are Rainham, Rainham (Essex) and Dagenham Dock.
Which tube stations are available in or near Rainham?
Some of the tube stations available in or near Rainham are Elm Park, Dagenham East and Dagenham Heathway.
Property Price Paid in Rainham by Year
The average sold property price by year was:
| Year | Average Sold Price | Price Change |
Sold Properties
|
|---|---|---|---|
| 2024 | £370,263 | -8% |
19 Properties |
| 2023 | £399,392 | -4% |
300 Properties |
| 2022 | £414,433 | 11% |
413 Properties |
| 2021 | £367,124 | 8% |
565 Properties |
| 2020 | £338,824 | 2% |
327 Properties |
| 2019 | £332,629 | 0,1% |
463 Properties |
| 2018 | £332,423 | 4% |
430 Properties |
| 2017 | £319,196 | 4% |
422 Properties |
| 2016 | £305,663 | 14% |
440 Properties |
| 2015 | £262,415 | 8% |
473 Properties |
| 2014 | £240,378 | 13% |
476 Properties |
| 2013 | £208,100 | 4% |
352 Properties |
| 2012 | £200,615 | 1% |
297 Properties |
| 2011 | £199,539 | 3% |
266 Properties |
| 2010 | £193,378 | 2% |
263 Properties |
| 2009 | £189,414 | -13% |
249 Properties |
| 2008 | £213,618 | 2% |
265 Properties |
| 2007 | £208,980 | 7% |
553 Properties |
| 2006 | £193,768 | 7% |
572 Properties |
| 2005 | £180,737 | 0,2% |
467 Properties |
| 2004 | £180,436 | 10% |
484 Properties |
| 2003 | £162,027 | 17% |
451 Properties |
| 2002 | £133,998 | 16% |
531 Properties |
| 2001 | £112,992 | 10% |
565 Properties |
| 2000 | £101,278 | 19% |
491 Properties |
| 1999 | £82,346 | 8% |
509 Properties |
| 1998 | £75,721 | 15% |
403 Properties |
| 1997 | £64,536 | 5% |
512 Properties |
| 1996 | £61,140 | 6% |
392 Properties |
| 1995 | £57,527 | - |
392 Properties |
Property Price per Property Type in Rainham
Here you can find historic sold price data in order to help with your property search.
The average Property Paid Price for specific property types in the last three years are:
| Property Type | Average Sold Price | Sold Properties |
|---|---|---|
| Semi Detached House | £423,632.00 | 368 Semi Detached Houses |
| Terraced House | £384,998.00 | 545 Terraced Houses |
| Detached House | £499,702.00 | 195 Detached Houses |
| Flat | £223,682.00 | 189 Flats |