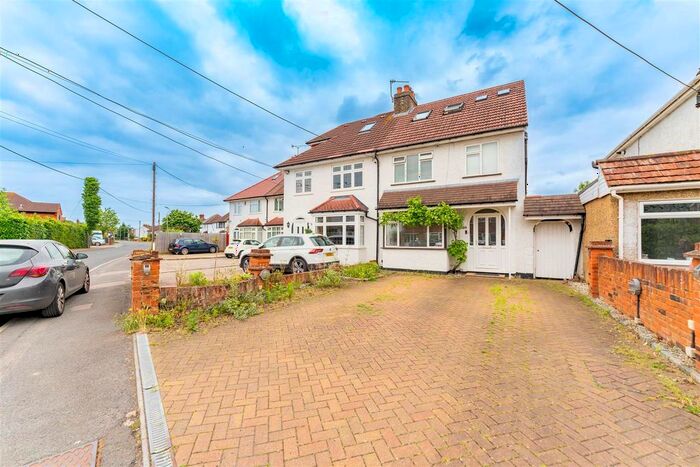
Houses for sale & to rent in Uxbridge, Hillingdon London Borough
House Prices in Uxbridge
Properties in this part of Uxbridge within the Hillingdon London Borough have an average house price of £498,551.00 and had 3,085 Property Transactions within the last 3 years.¹ This area has 28,194 households² , where the most expensive property was sold for £10,774,170.00.
Properties for sale in Uxbridge
Neighbourhoods in Uxbridge
Navigate through our locations to find the location of your next house in Uxbridge, Hillingdon London Borough for sale or to rent.
Transport in Uxbridge
Please see below transportation links in this area:
-
Uxbridge Station
-
Hillingdon Station
-
Ickenham Station
-
West Ruislip Station
-
Denham Station
-
Ruislip Station
-
Ruislip Gardens Station
-
West Drayton Station
-
Ruislip Manor Station
-
South Ruislip Station
- FAQ
- Price Paid By Year
- Property Type Price
Frequently asked questions about Uxbridge
What is the average price for a property for sale in Uxbridge?
The average price for a property for sale in Uxbridge is £498,551. This amount is 0.3% lower than the average price in Hillingdon London Borough. There are more than 10,000 property listings for sale in Uxbridge.
What locations have the most expensive properties for sale in Uxbridge?
The locations with the most expensive properties for sale in Uxbridge are Ickenham at an average of £739,054, Charville at an average of £557,500 and Uxbridge North at an average of £528,913.
What locations have the most affordable properties for sale in Uxbridge?
The locations with the most affordable properties for sale in Uxbridge are Yiewsley at an average of £383,586, Uxbridge South at an average of £386,484 and Botwell at an average of £441,390.
Which train stations are available in or near Uxbridge?
Some of the train stations available in or near Uxbridge are West Ruislip, Denham and West Drayton.
Which tube stations are available in or near Uxbridge?
Some of the tube stations available in or near Uxbridge are Uxbridge, Hillingdon and Ickenham.
Property Price Paid in Uxbridge by Year
The average sold property price by year was:
| Year | Average Sold Price | Price Change |
Sold Properties
|
|---|---|---|---|
| 2024 | £498,871 | 1% |
39 Properties |
| 2023 | £495,590 | -7% |
689 Properties |
| 2022 | £531,840 | 10% |
984 Properties |
| 2021 | £476,171 | 4% |
1,373 Properties |
| 2020 | £457,769 | 8% |
947 Properties |
| 2019 | £422,349 | -1% |
1,377 Properties |
| 2018 | £426,740 | -8% |
1,241 Properties |
| 2017 | £461,688 | 5% |
1,136 Properties |
| 2016 | £439,220 | 11% |
1,211 Properties |
| 2015 | £391,493 | 11% |
1,240 Properties |
| 2014 | £349,832 | 9% |
1,197 Properties |
| 2013 | £317,157 | 3% |
906 Properties |
| 2012 | £308,682 | 5% |
859 Properties |
| 2011 | £294,748 | 4% |
971 Properties |
| 2010 | £282,826 | 11% |
946 Properties |
| 2009 | £251,865 | -8% |
793 Properties |
| 2008 | £271,631 | -6% |
846 Properties |
| 2007 | £288,803 | 10% |
1,546 Properties |
| 2006 | £260,077 | 9% |
1,448 Properties |
| 2005 | £237,942 | 2% |
1,316 Properties |
| 2004 | £232,211 | 4% |
1,485 Properties |
| 2003 | £223,949 | 14% |
1,513 Properties |
| 2002 | £192,788 | 15% |
1,549 Properties |
| 2001 | £164,734 | 8% |
1,205 Properties |
| 2000 | £151,179 | 15% |
1,461 Properties |
| 1999 | £129,112 | 16% |
1,554 Properties |
| 1998 | £109,068 | 10% |
1,358 Properties |
| 1997 | £98,300 | 13% |
1,418 Properties |
| 1996 | £85,877 | -2% |
1,358 Properties |
| 1995 | £87,464 | - |
993 Properties |
Property Price per Property Type in Uxbridge
Here you can find historic sold price data in order to help with your property search.
The average Property Paid Price for specific property types in the last three years are:
| Property Type | Average Sold Price | Sold Properties |
|---|---|---|
| Terraced House | £460,104.00 | 761 Terraced Houses |
| Flat | £299,297.00 | 831 Flats |
| Semi Detached House | £542,704.00 | 969 Semi Detached Houses |
| Detached House | £788,733.00 | 524 Detached Houses |


