
Houses for sale & to rent in Isleworth, Hounslow London Borough
House Prices in Isleworth
Properties in this part of Isleworth within the Hounslow London Borough have an average house price of £525,391.00 and had 1,330 Property Transactions within the last 3 years.¹ This area has 14,360 households² , where the most expensive property was sold for £3,420,000.00.
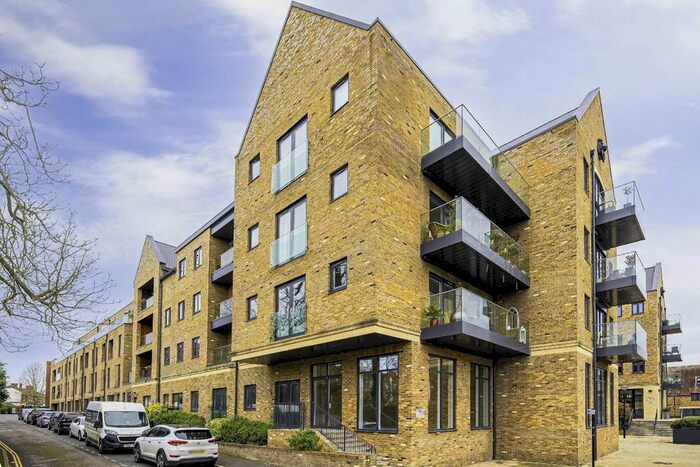
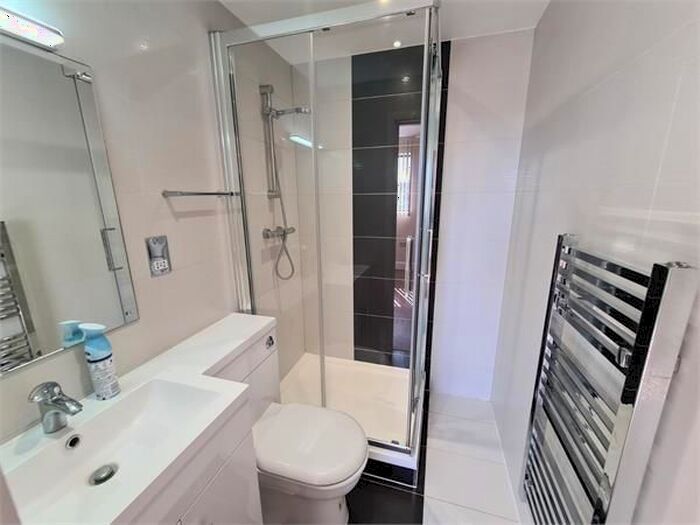
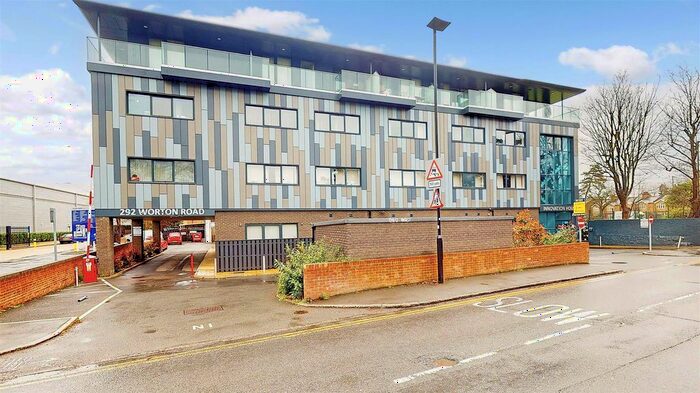
Properties for sale in Isleworth


Neighbourhoods in Isleworth
Navigate through our locations to find the location of your next house in Isleworth, Hounslow London Borough for sale or to rent.
Transport in Isleworth
Please see below transportation links in this area:
-
 Isleworth Station
 -
Syon Lane Station
-
 Hounslow East Station
 -
Osterley Station
-
Hounslow Central Station
-
Hounslow Station
-
St Margarets Station
-
Brentford Station
-
Twickenham Station
-
 Richmond Station
- FAQ
- Price Paid By Year
- Property Type Price
Frequently asked questions about Isleworth
What is the average price for a property for sale in Isleworth?
The average price for a property for sale in Isleworth is £525,391. This amount is 9% lower than the average price in Hounslow London Borough. There are 8,025 property listings for sale in Isleworth.
What locations have the most expensive properties for sale in Isleworth?
The locations with the most expensive properties for sale in Isleworth are Osterley And Spring Grove at an average of £583,341, Hounslow South at an average of £533,748 and Isleworth at an average of £521,251.
What locations have the most affordable properties for sale in Isleworth?
The locations with the most affordable properties for sale in Isleworth are Hounslow Central at an average of £367,274 and Syon at an average of £477,231.
Which train stations are available in or near Isleworth?
Some of the train stations available in or near Isleworth are Isleworth, Syon Lane and Hounslow.
Which tube stations are available in or near Isleworth?
Some of the tube stations available in or near Isleworth are Hounslow East, Osterley and Hounslow Central.
Property Price Paid in Isleworth by Year
The average sold property price by year was:
| Year | Average Sold Price | Price Change |
Sold Properties
|
|---|---|---|---|
| 2024 | £523,562 | -4% |
24 Properties |
| 2023 | £544,149 | 1% |
305 Properties |
| 2022 | £539,138 | 6% |
438 Properties |
| 2021 | £504,613 | 3% |
563 Properties |
| 2020 | £489,516 | -1% |
396 Properties |
| 2019 | £492,734 | -4% |
475 Properties |
| 2018 | £511,801 | 6% |
523 Properties |
| 2017 | £480,086 | 6% |
586 Properties |
| 2016 | £449,967 | 9% |
494 Properties |
| 2015 | £408,725 | 7% |
535 Properties |
| 2014 | £380,135 | 3% |
573 Properties |
| 2013 | £367,137 | 9% |
519 Properties |
| 2012 | £334,566 | 9% |
452 Properties |
| 2011 | £304,489 | 9% |
388 Properties |
| 2010 | £277,315 | 3% |
530 Properties |
| 2009 | £269,951 | -7% |
362 Properties |
| 2008 | £289,241 | -5% |
548 Properties |
| 2007 | £303,799 | 11% |
792 Properties |
| 2006 | £270,470 | 6% |
767 Properties |
| 2005 | £255,053 | -0,2% |
575 Properties |
| 2004 | £255,689 | 9% |
738 Properties |
| 2003 | £233,803 | 12% |
766 Properties |
| 2002 | £206,040 | 11% |
758 Properties |
| 2001 | £182,829 | 12% |
711 Properties |
| 2000 | £160,748 | 15% |
674 Properties |
| 1999 | £137,035 | 13% |
665 Properties |
| 1998 | £119,623 | 19% |
593 Properties |
| 1997 | £97,271 | 9% |
657 Properties |
| 1996 | £88,671 | 10% |
658 Properties |
| 1995 | £79,802 | - |
571 Properties |
Property Price per Property Type in Isleworth
Here you can find historic sold price data in order to help with your property search.
The average Property Paid Price for specific property types in the last three years are:
| Property Type | Average Sold Price | Sold Properties |
|---|---|---|
| Semi Detached House | £672,969.00 | 297 Semi Detached Houses |
| Terraced House | £608,997.00 | 425 Terraced Houses |
| Detached House | £1,050,670.00 | 44 Detached Houses |
| Flat | £343,698.00 | 564 Flats |