
Houses for sale & to rent in Huddersfield, Kirklees
House Prices in Huddersfield
Properties in Huddersfield have an average house price of £206,694.00 and had 9,057 Property Transactions within the last 3 years.¹
Huddersfield is an area in Kirklees with 84,041 households², where the most expensive property was sold for £2,200,000.00.
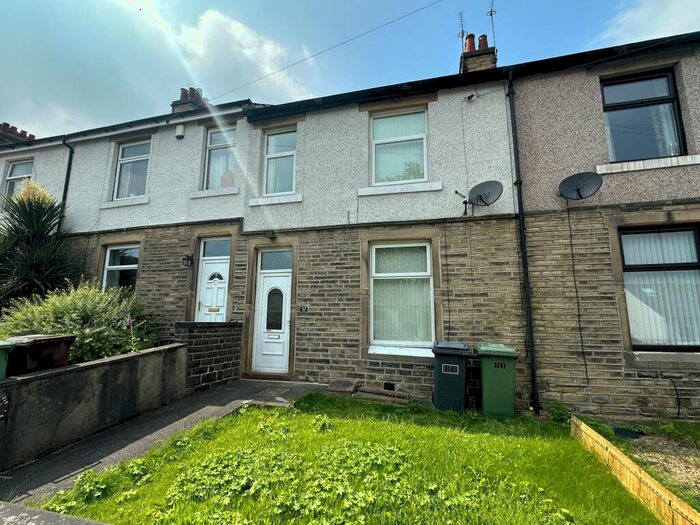
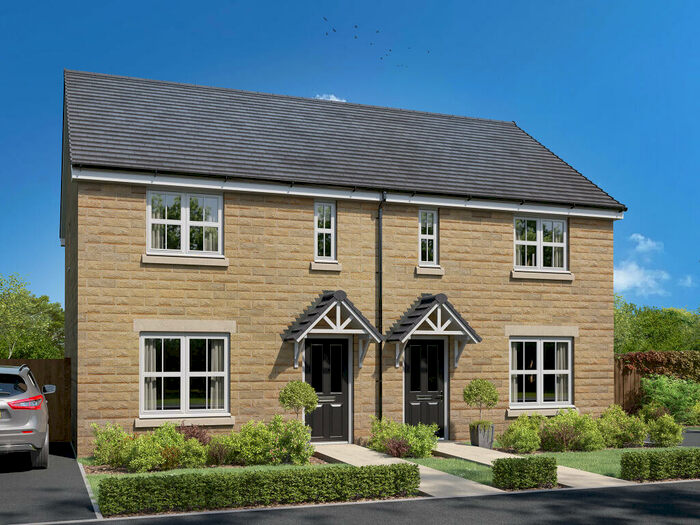
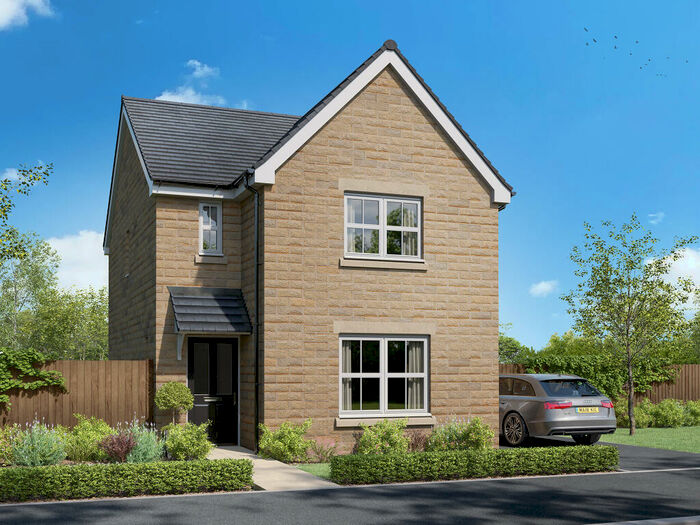
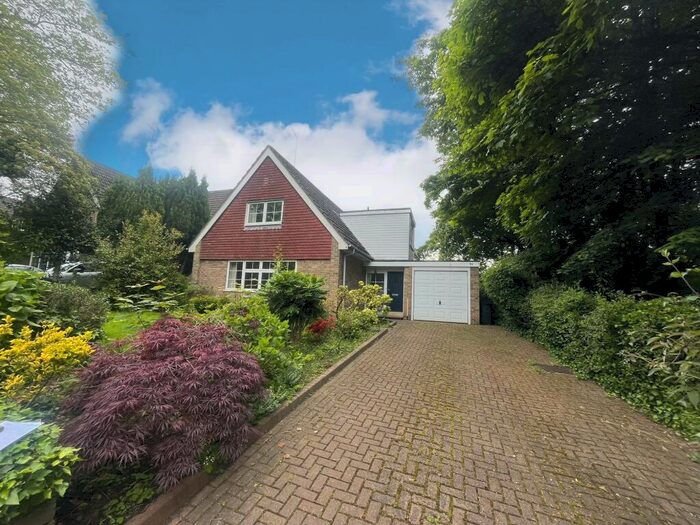
Properties for sale in Huddersfield


Neighbourhoods in Huddersfield
Navigate through our locations to find the location of your next house in Huddersfield, Kirklees for sale or to rent.
Transport in Huddersfield
Please see below transportation links in this area:
-
 Huddersfield Station
 -
Lockwood Station
-
Berry Brow Station
-
Honley Station
-
Deighton Station
-
Brockholes Station
- FAQ
- Price Paid By Year
- Property Type Price
Frequently asked questions about Huddersfield
What is the average price for a property for sale in Huddersfield?
The average price for a property for sale in Huddersfield is £206,694. This amount is 0.49% lower than the average price in Kirklees. There are more than 10,000 property listings for sale in Huddersfield.
What locations have the most expensive properties for sale in Huddersfield?
The locations with the most expensive properties for sale in Huddersfield are Holme Valley South at an average of £621,125, Holme Valley North at an average of £581,218 and Kirkburton at an average of £326,510.
What locations have the most affordable properties for sale in Huddersfield?
The locations with the most affordable properties for sale in Huddersfield are Newsome at an average of £151,438, Greenhead at an average of £163,532 and Golcar at an average of £164,165.
Which train stations are available in or near Huddersfield?
Some of the train stations available in or near Huddersfield are Huddersfield, Lockwood and Berry Brow.
Property Price Paid in Huddersfield by Year
The average sold property price by year was:
| Year | Average Sold Price | Price Change |
Sold Properties
|
|---|---|---|---|
| 2024 | £197,736 | -6% |
122 Properties |
| 2023 | £209,827 | 2% |
2,194 Properties |
| 2022 | £206,044 | 0,2% |
2,982 Properties |
| 2021 | £205,672 | 8% |
3,759 Properties |
| 2020 | £188,646 | 5% |
2,849 Properties |
| 2019 | £180,151 | 3% |
3,221 Properties |
| 2018 | £175,586 | 5% |
3,348 Properties |
| 2017 | £167,426 | 4% |
3,280 Properties |
| 2016 | £160,963 | 2% |
3,221 Properties |
| 2015 | £157,342 | 3% |
3,018 Properties |
| 2014 | £152,307 | 3% |
2,855 Properties |
| 2013 | £147,029 | -2% |
2,350 Properties |
| 2012 | £150,267 | 3% |
2,140 Properties |
| 2011 | £145,547 | -3% |
1,897 Properties |
| 2010 | £149,922 | 3% |
1,999 Properties |
| 2009 | £145,938 | -5% |
2,063 Properties |
| 2008 | £152,667 | -0,3% |
2,431 Properties |
| 2007 | £153,094 | 5% |
4,616 Properties |
| 2006 | £145,599 | 7% |
4,868 Properties |
| 2005 | £135,009 | 10% |
3,935 Properties |
| 2004 | £121,191 | 19% |
4,373 Properties |
| 2003 | £97,984 | 22% |
4,642 Properties |
| 2002 | £76,696 | 12% |
4,597 Properties |
| 2001 | £67,472 | 6% |
4,100 Properties |
| 2000 | £63,647 | 5% |
3,444 Properties |
| 1999 | £60,254 | 4% |
3,477 Properties |
| 1998 | £58,002 | 4% |
3,162 Properties |
| 1997 | £55,958 | 5% |
3,265 Properties |
| 1996 | £53,338 | 4% |
2,905 Properties |
| 1995 | £51,178 | - |
2,689 Properties |
Property Price per Property Type in Huddersfield
Here you can find historic sold price data in order to help with your property search.
The average Property Paid Price for specific property types in the last three years are:
| Property Type | Average Sold Price | Sold Properties |
|---|---|---|
| Terraced House | £145,515.00 | 3,929 Terraced Houses |
| Flat | £115,185.00 | 633 Flats |
| Semi Detached House | £201,162.00 | 2,691 Semi Detached Houses |
| Detached House | £380,301.00 | 1,804 Detached Houses |