
Houses for sale & to rent in Spalding, Lincolnshire
House Prices in Spalding
Properties in Spalding have an average house price of £242,321.00 and had 4,716 Property Transactions within the last 3 years.¹
Spalding is an area in Lincolnshire with 34,998 households², where the most expensive property was sold for £1,400,000.00.
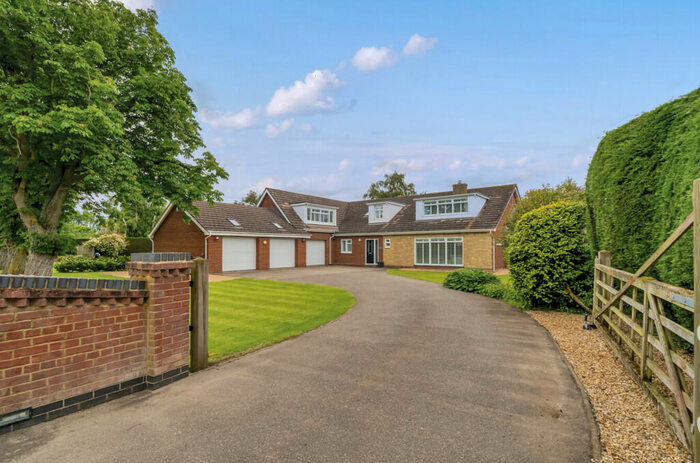
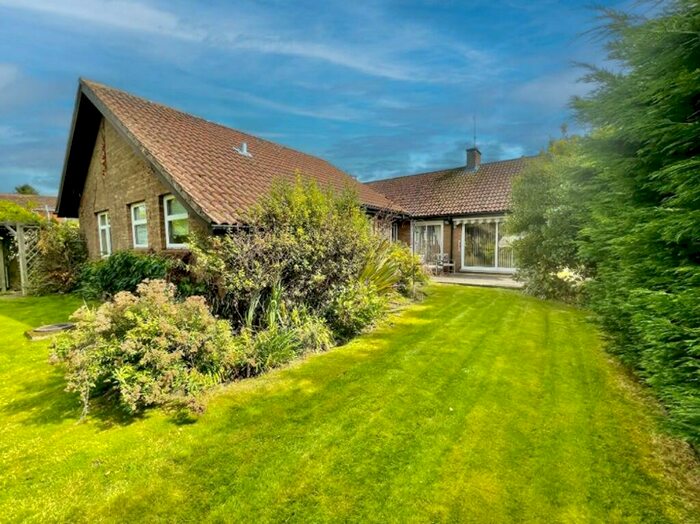
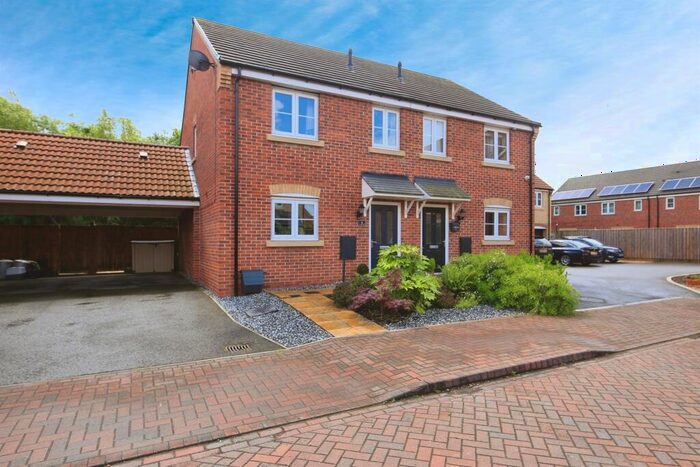
Properties for sale in Spalding


Neighbourhoods in Spalding
Navigate through our locations to find the location of your next house in Spalding, Lincolnshire for sale or to rent.
- Crowland And Deeping St Nicholas
- Deeping St James
- Donington, Quadring And Gosberton
- Five Village
- Fleet
- Gedney
- Holbeach Hurn
- Holbeach Town
- Long Sutton
- Market And West Deeping
- Moulton, Weston And Cowbit
- Pinchbeck And Surfleet
- Spalding Castle
- Spalding Monks House
- Spalding St Johns
- Spalding St Marys
- Spalding St Pauls
- Spalding Wygate
- Sutton Bridge
- The Saints
- Whaplode And Holbeach St Johns
Transport in Spalding
Please see below transportation links in this area:

- FAQ
- Price Paid By Year
- Property Type Price
Frequently asked questions about Spalding
What is the average price for a property for sale in Spalding?
The average price for a property for sale in Spalding is £242,321. This amount is 0.43% higher than the average price in Lincolnshire. There are more than 10,000 property listings for sale in Spalding.
What locations have the most expensive properties for sale in Spalding?
The locations with the most expensive properties for sale in Spalding are The Saints at an average of £337,059, Moulton, Weston And Cowbit at an average of £293,568 and Whaplode And Holbeach St Johns at an average of £292,061.
What locations have the most affordable properties for sale in Spalding?
The locations with the most affordable properties for sale in Spalding are Five Village at an average of £88,975, Spalding St Johns at an average of £190,711 and Sutton Bridge at an average of £192,468.
Which train stations are available in or near Spalding?
Some of the train stations available in or near Spalding are Spalding, Hubberts Bridge and Boston.
Property Price Paid in Spalding by Year
The average sold property price by year was:
| Year | Average Sold Price | Price Change |
Sold Properties
|
|---|---|---|---|
| 2024 | £249,465 | 2% |
71 Properties |
| 2023 | £243,540 | -3% |
1,002 Properties |
| 2022 | £251,493 | 7% |
1,540 Properties |
| 2021 | £234,783 | 11% |
2,103 Properties |
| 2020 | £208,747 | 5% |
1,469 Properties |
| 2019 | £197,799 | 1% |
1,658 Properties |
| 2018 | £195,016 | 6% |
1,636 Properties |
| 2017 | £184,122 | 4% |
1,604 Properties |
| 2016 | £176,385 | 6% |
1,699 Properties |
| 2015 | £164,939 | 4% |
1,744 Properties |
| 2014 | £158,743 | 7% |
1,739 Properties |
| 2013 | £148,417 | -1% |
1,473 Properties |
| 2012 | £149,998 | 6% |
1,095 Properties |
| 2011 | £141,664 | -7% |
1,128 Properties |
| 2010 | £151,297 | 7% |
1,103 Properties |
| 2009 | £140,055 | -9% |
1,106 Properties |
| 2008 | £152,045 | -7% |
1,065 Properties |
| 2007 | £162,540 | 6% |
2,321 Properties |
| 2006 | £153,540 | 3% |
2,209 Properties |
| 2005 | £149,467 | 7% |
1,904 Properties |
| 2004 | £138,372 | 12% |
2,226 Properties |
| 2003 | £122,020 | 19% |
2,280 Properties |
| 2002 | £99,003 | 15% |
2,577 Properties |
| 2001 | £84,329 | 11% |
2,301 Properties |
| 2000 | £75,407 | 17% |
2,136 Properties |
| 1999 | £62,350 | 10% |
2,151 Properties |
| 1998 | £56,315 | 6% |
1,864 Properties |
| 1997 | £52,979 | 9% |
1,897 Properties |
| 1996 | £48,247 | 0,4% |
1,584 Properties |
| 1995 | £48,052 | - |
1,232 Properties |
Property Price per Property Type in Spalding
Here you can find historic sold price data in order to help with your property search.
The average Property Paid Price for specific property types in the last three years are:
| Property Type | Average Sold Price | Sold Properties |
|---|---|---|
| Terraced House | £155,082.00 | 610 Terraced Houses |
| Flat | £96,222.00 | 142 Flats |
| Semi Detached House | £186,559.00 | 1,250 Semi Detached Houses |
| Detached House | £295,256.00 | 2,714 Detached Houses |