
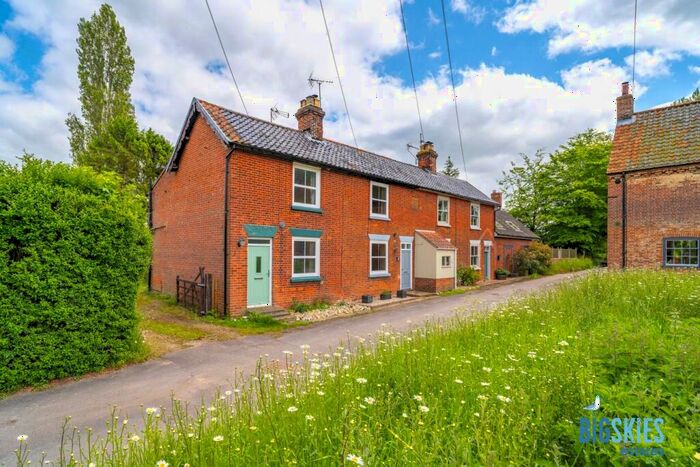
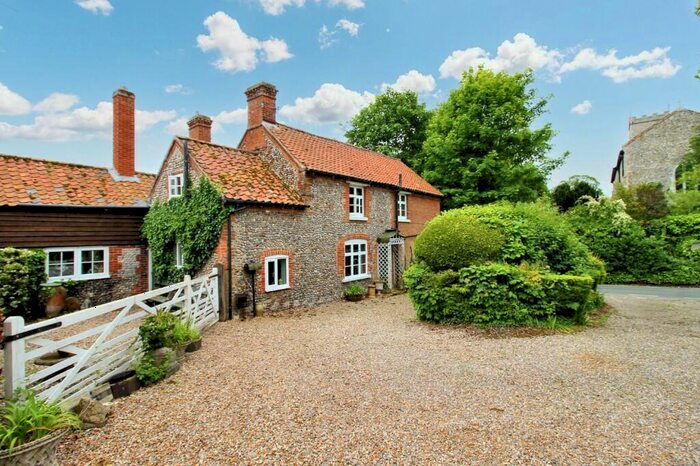
Houses for sale & to rent in Holt, Norfolk
House Prices in Holt
Properties in Holt have an average house price of £503,179.00 and had 691 Property Transactions within the last 3 years.¹
Holt is an area in Norfolk with 4,194 households², where the most expensive property was sold for £4,650,000.00.
Properties for sale in Holt


Neighbourhoods in Holt
Navigate through our locations to find the location of your next house in Holt, Norfolk for sale or to rent.
Transport in Holt
Please see below transportation links in this area:

- FAQ
- Price Paid By Year
- Property Type Price
Frequently asked questions about Holt
What is the average price for a property for sale in Holt?
The average price for a property for sale in Holt is £503,179. This amount is 50% higher than the average price in Norfolk. There are 1,823 property listings for sale in Holt.
What locations have the most expensive properties for sale in Holt?
The locations with the most expensive properties for sale in Holt are Glaven Valley at an average of £751,230, High Heath at an average of £639,480 and Coastal at an average of £620,708.
What locations have the most affordable properties for sale in Holt?
The locations with the most affordable properties for sale in Holt are Corpusty at an average of £394,569, Holt at an average of £396,539 and Chaucer at an average of £410,500.
Which train stations are available in or near Holt?
Some of the train stations available in or near Holt are Sheringham, West Runton and Cromer.
Property Price Paid in Holt by Year
The average sold property price by year was:
| Year | Average Sold Price | Price Change |
Sold Properties
|
|---|---|---|---|
| 2024 | £524,608 | -5% |
23 Properties |
| 2023 | £548,836 | 5% |
135 Properties |
| 2022 | £520,757 | 9% |
201 Properties |
| 2021 | £472,487 | 8% |
332 Properties |
| 2020 | £433,623 | 7% |
262 Properties |
| 2019 | £402,367 | 9% |
261 Properties |
| 2018 | £364,701 | -12% |
275 Properties |
| 2017 | £406,665 | 5% |
261 Properties |
| 2016 | £384,882 | 8% |
208 Properties |
| 2015 | £354,120 | 7% |
256 Properties |
| 2014 | £331,039 | 8% |
256 Properties |
| 2013 | £304,856 | 3% |
240 Properties |
| 2012 | £296,569 | -4% |
163 Properties |
| 2011 | £309,561 | 6% |
194 Properties |
| 2010 | £290,570 | 10% |
182 Properties |
| 2009 | £260,239 | 0,4% |
183 Properties |
| 2008 | £259,267 | -9% |
199 Properties |
| 2007 | £283,663 | 10% |
263 Properties |
| 2006 | £256,494 | -3% |
276 Properties |
| 2005 | £264,733 | 18% |
170 Properties |
| 2004 | £215,804 | 8% |
238 Properties |
| 2003 | £197,960 | 9% |
244 Properties |
| 2002 | £179,398 | 24% |
233 Properties |
| 2001 | £136,025 | 8% |
267 Properties |
| 2000 | £125,728 | 21% |
213 Properties |
| 1999 | £99,833 | 2% |
250 Properties |
| 1998 | £97,643 | 17% |
213 Properties |
| 1997 | £81,094 | 9% |
267 Properties |
| 1996 | £73,853 | 1% |
278 Properties |
| 1995 | £72,865 | - |
184 Properties |
Property Price per Property Type in Holt
Here you can find historic sold price data in order to help with your property search.
The average Property Paid Price for specific property types in the last three years are:
| Property Type | Average Sold Price | Sold Properties |
|---|---|---|
| Semi Detached House | £381,422.00 | 132 Semi Detached Houses |
| Terraced House | £352,855.00 | 131 Terraced Houses |
| Detached House | £626,095.00 | 390 Detached Houses |
| Flat | £182,844.00 | 38 Flats |