
Houses for sale & to rent in Goole, North Yorkshire
House Prices in Goole
Properties in Goole have an average house price of £241,258.00 and had 435 Property Transactions within the last 3 years.¹
Goole is an area in North Yorkshire with 3,210 households², where the most expensive property was sold for £685,000.00.
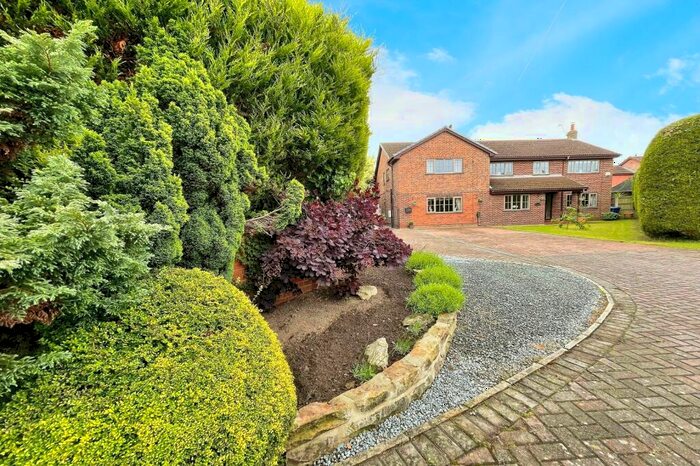
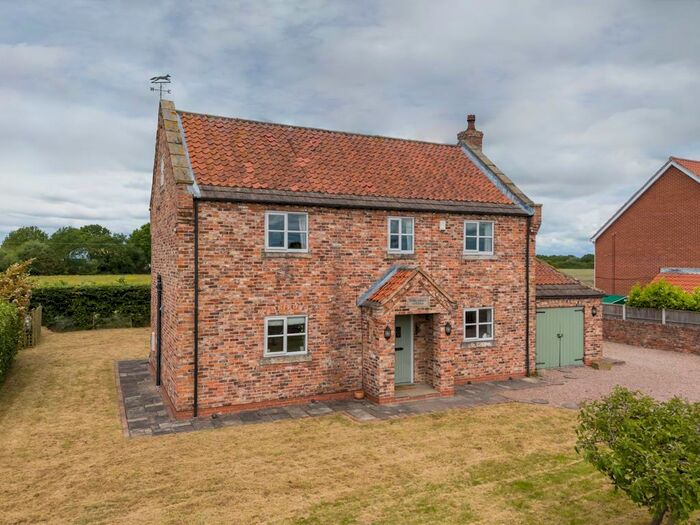
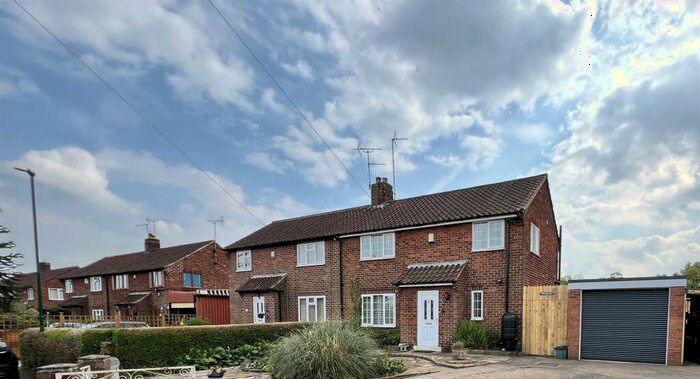
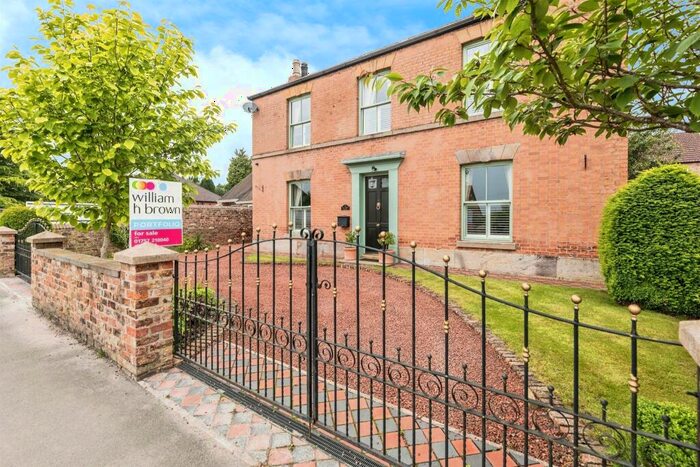
Properties for sale in Goole


Neighbourhoods in Goole
Navigate through our locations to find the location of your next house in Goole, North Yorkshire for sale or to rent.
Transport in Goole
Please see below transportation links in this area:

- FAQ
- Price Paid By Year
- Property Type Price
Frequently asked questions about Goole
What is the average price for a property for sale in Goole?
The average price for a property for sale in Goole is £241,258. This amount is 24% lower than the average price in North Yorkshire. There are 3,538 property listings for sale in Goole.
What locations have the most expensive properties for sale in Goole?
The locations with the most expensive properties for sale in Goole are Monk Fryston at an average of £279,500, Whitley at an average of £264,859 and Camblesforth at an average of £246,761.
What locations have the most affordable properties for sale in Goole?
The locations with the most affordable properties for sale in Goole are Camblesforth & Carlton at an average of £181,352 and Eggborough at an average of £223,589.
Which train stations are available in or near Goole?
Some of the train stations available in or near Goole are Hensall, Whitley Bridge and Snaith.
Property Price Paid in Goole by Year
The average sold property price by year was:
| Year | Average Sold Price | Price Change |
Sold Properties
|
|---|---|---|---|
| 2024 | £197,375 | -24% |
4 Properties |
| 2023 | £244,912 | -6% |
109 Properties |
| 2022 | £258,932 | 10% |
104 Properties |
| 2021 | £231,805 | 4% |
218 Properties |
| 2020 | £221,893 | 10% |
126 Properties |
| 2019 | £200,755 | 9% |
231 Properties |
| 2018 | £183,676 | -12% |
201 Properties |
| 2017 | £205,140 | 7% |
151 Properties |
| 2016 | £190,717 | 2% |
167 Properties |
| 2015 | £185,968 | 8% |
166 Properties |
| 2014 | £170,217 | -1% |
147 Properties |
| 2013 | £172,523 | -1% |
79 Properties |
| 2012 | £174,223 | 4% |
108 Properties |
| 2011 | £166,923 | 3% |
83 Properties |
| 2010 | £162,738 | -5% |
89 Properties |
| 2009 | £171,613 | 0,2% |
97 Properties |
| 2008 | £171,309 | -10% |
96 Properties |
| 2007 | £187,665 | 2% |
187 Properties |
| 2006 | £184,235 | 4% |
182 Properties |
| 2005 | £177,299 | 13% |
178 Properties |
| 2004 | £153,366 | 8% |
193 Properties |
| 2003 | £140,681 | 24% |
190 Properties |
| 2002 | £106,245 | 22% |
196 Properties |
| 2001 | £82,702 | 13% |
164 Properties |
| 2000 | £72,161 | 15% |
138 Properties |
| 1999 | £61,444 | -5% |
151 Properties |
| 1998 | £64,487 | 10% |
101 Properties |
| 1997 | £57,885 | 4% |
128 Properties |
| 1996 | £55,418 | -10% |
97 Properties |
| 1995 | £61,020 | - |
98 Properties |
Property Price per Property Type in Goole
Here you can find historic sold price data in order to help with your property search.
The average Property Paid Price for specific property types in the last three years are:
| Property Type | Average Sold Price | Sold Properties |
|---|---|---|
| Semi Detached House | £196,618.00 | 141 Semi Detached Houses |
| Terraced House | £157,530.00 | 73 Terraced Houses |
| Detached House | £305,177.00 | 213 Detached Houses |
| Flat | £90,250.00 | 8 Flats |