
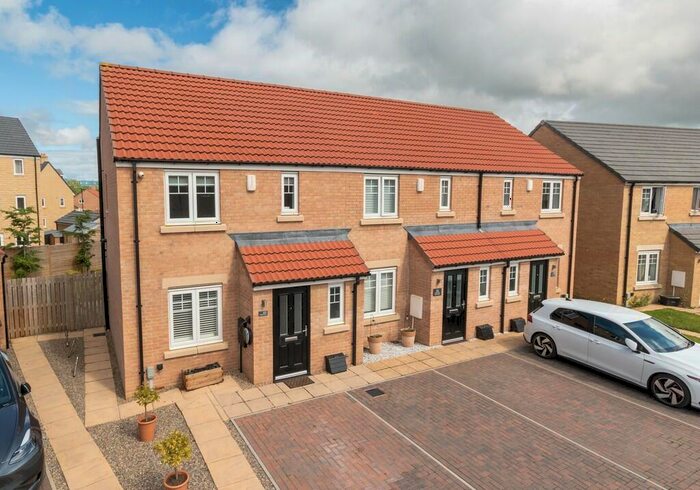
Houses for sale & to rent in Harrogate, North Yorkshire
House Prices in Harrogate
Properties in Harrogate have an average house price of £390,395.00 and had 5,913 Property Transactions within the last 3 years.¹
Harrogate is an area in North Yorkshire with 40,714 households², where the most expensive property was sold for £3,515,000.00.
Properties for sale in Harrogate


Neighbourhoods in Harrogate
Navigate through our locations to find the location of your next house in Harrogate, North Yorkshire for sale or to rent.
- Barden Fell
- Bilton
- Bishop Monkton
- Claro
- Granby
- Harlow Moor
- High Harrogate
- Hookstone
- Killinghall
- Knaresborough Scriven Park
- Low Harrogate
- Lower Nidderdale
- New Park
- Nidd Valley
- Pannal
- Pateley Bridge
- Ribston
- Rossett
- Saltergate
- Spofforth With Lower Wharfedale
- Starbeck
- Stray
- Washburn
- Woodfield
- Harrogate Central
- Harrogate Coppice Valley
- Harrogate New Park
- Harrogate Duchy
- Harrogate Valley Gardens
- Harrogate High Harrogate
- Harrogate Bilton Grange
- Harrogate Old Bilton
- Harrogate Starbeck
- Harrogate Bilton Woodfield
- Harrogate Kingsley
- Harrogate Harlow
- Harrogate St Georges
- Harrogate Stray
- Harrogate Fairfax
- Harrogate Hookstone
- Harrogate Oatlands
- Harrogate Pannal
- Killinghall & Hampsthwaite
- Pateley Bridge & Nidderdale Moors
- Harrogate Saltergate
- Fountains & Ripley
- Bishop Monkton & Newby
- Boroughbridge & Claro
- High Harrogate & Kingsley
- Bilton & Nidd Gorge
- Stray, Woodlands & Hookstone
- Harlow & St. Georges
- Washburn & Birstwith
- Oatlands & Pannal
- Coppice Valley & Duchy
- Killinghall, Hampsthwaite & Saltergate
- Pateley Bridge & Nidderdale
- Masham & Fountains
Transport in Harrogate
Please see below transportation links in this area:

- FAQ
- Price Paid By Year
- Property Type Price
Frequently asked questions about Harrogate
What is the average price for a property for sale in Harrogate?
The average price for a property for sale in Harrogate is £390,395. This amount is 24% higher than the average price in North Yorkshire. There are more than 10,000 property listings for sale in Harrogate.
What locations have the most expensive properties for sale in Harrogate?
The locations with the most expensive properties for sale in Harrogate are Ribston at an average of £824,214, Fountains & Ripley at an average of £729,000 and Bishop Monkton & Newby at an average of £700,000.
What locations have the most affordable properties for sale in Harrogate?
The locations with the most affordable properties for sale in Harrogate are Woodfield at an average of £239,112, Starbeck at an average of £243,286 and New Park at an average of £243,371.
Which train stations are available in or near Harrogate?
Some of the train stations available in or near Harrogate are Harrogate, Hornbeam Park and Starbeck.
Property Price Paid in Harrogate by Year
The average sold property price by year was:
| Year | Average Sold Price | Price Change |
Sold Properties
|
|---|---|---|---|
| 2024 | £336,503 | -20% |
108 Properties |
| 2023 | £402,951 | 0,3% |
1,314 Properties |
| 2022 | £401,681 | 6% |
1,860 Properties |
| 2021 | £378,357 | 5% |
2,631 Properties |
| 2020 | £359,811 | 2% |
1,581 Properties |
| 2019 | £352,243 | 7% |
1,850 Properties |
| 2018 | £328,267 | -6% |
1,900 Properties |
| 2017 | £347,492 | 9% |
2,017 Properties |
| 2016 | £317,317 | 4% |
2,118 Properties |
| 2015 | £304,745 | 10% |
2,023 Properties |
| 2014 | £275,079 | 1% |
2,149 Properties |
| 2013 | £272,229 | 3% |
1,719 Properties |
| 2012 | £264,462 | -1% |
1,440 Properties |
| 2011 | £266,425 | -2% |
1,455 Properties |
| 2010 | £270,904 | 7% |
1,463 Properties |
| 2009 | £251,026 | -9% |
1,416 Properties |
| 2008 | £273,526 | 0,1% |
1,154 Properties |
| 2007 | £273,311 | 11% |
2,295 Properties |
| 2006 | £244,359 | 7% |
2,782 Properties |
| 2005 | £228,092 | 4% |
2,055 Properties |
| 2004 | £219,619 | 13% |
2,568 Properties |
| 2003 | £190,191 | 18% |
2,396 Properties |
| 2002 | £156,109 | 17% |
2,656 Properties |
| 2001 | £129,971 | 11% |
2,391 Properties |
| 2000 | £115,568 | 4% |
2,288 Properties |
| 1999 | £111,306 | 17% |
2,084 Properties |
| 1998 | £92,937 | 8% |
1,945 Properties |
| 1997 | £85,288 | 4% |
2,581 Properties |
| 1996 | £82,182 | 5% |
2,172 Properties |
| 1995 | £77,905 | - |
1,521 Properties |
Property Price per Property Type in Harrogate
Here you can find historic sold price data in order to help with your property search.
The average Property Paid Price for specific property types in the last three years are:
| Property Type | Average Sold Price | Sold Properties |
|---|---|---|
| Terraced House | £301,845.00 | 1,568 Terraced Houses |
| Flat | £255,481.00 | 1,223 Flats |
| Semi Detached House | £349,746.00 | 1,715 Semi Detached Houses |
| Detached House | £655,894.00 | 1,407 Detached Houses |