
Houses for sale & to rent in Peterborough, Northamptonshire
House Prices in Peterborough
Properties in Peterborough have an average house price of £433,424.00 and had 605 Property Transactions within the last 3 years.¹
Peterborough is an area in Northamptonshire with 5,022 households², where the most expensive property was sold for £2,250,000.00.
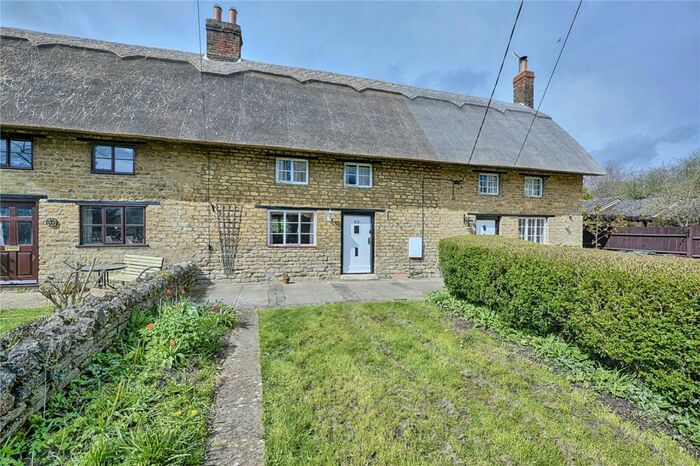
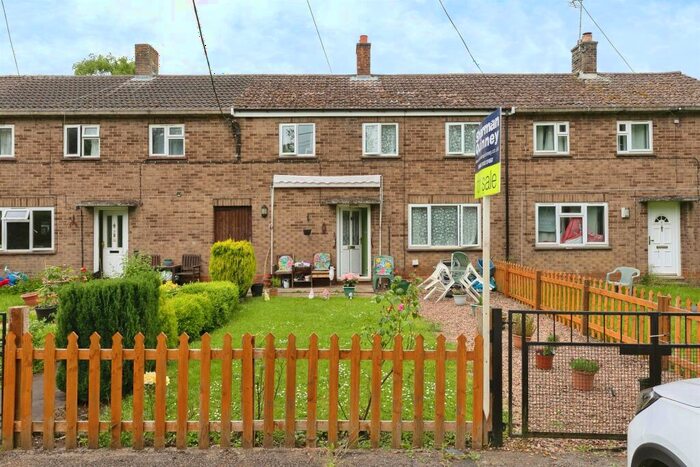
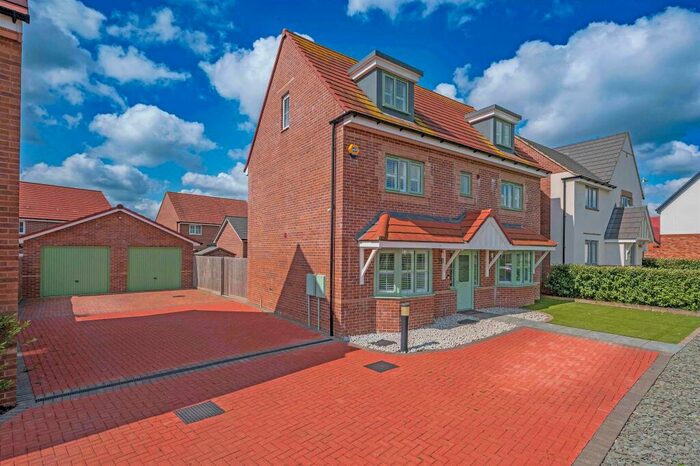
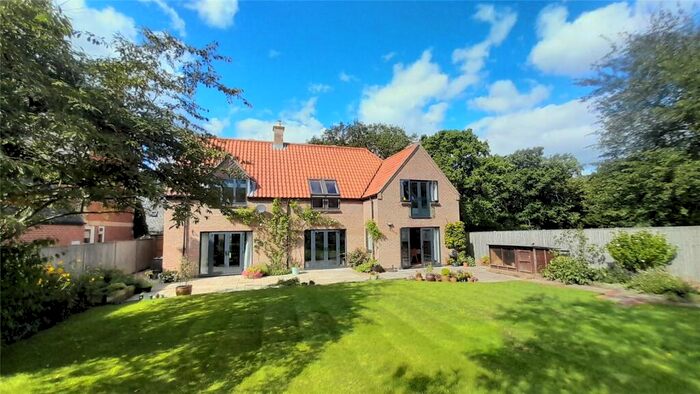
Properties for sale in Peterborough


Neighbourhoods in Peterborough
Navigate through our locations to find the location of your next house in Peterborough, Northamptonshire for sale or to rent.
Transport in Peterborough
Please see below transportation links in this area:

- FAQ
- Price Paid By Year
- Property Type Price
Frequently asked questions about Peterborough
What is the average price for a property for sale in Peterborough?
The average price for a property for sale in Peterborough is £433,424. This amount is 42% higher than the average price in Northamptonshire. There are 9,304 property listings for sale in Peterborough.
What locations have the most expensive properties for sale in Peterborough?
The locations with the most expensive properties for sale in Peterborough are Prebendal at an average of £526,866, Lower Nene at an average of £512,222 and Barnwell at an average of £442,647.
What locations have the most affordable properties for sale in Peterborough?
The locations with the most affordable properties for sale in Peterborough are Oundle at an average of £390,824 and Kings Forest at an average of £398,300.
Which train stations are available in or near Peterborough?
Some of the train stations available in or near Peterborough are Corby, Stamford and Peterborough.
Property Price Paid in Peterborough by Year
The average sold property price by year was:
| Year | Average Sold Price | Price Change |
Sold Properties
|
|---|---|---|---|
| 2024 | £494,178 | 13% |
7 Properties |
| 2023 | £429,897 | -2% |
128 Properties |
| 2022 | £439,139 | 2% |
187 Properties |
| 2021 | £429,740 | 7% |
283 Properties |
| 2020 | £400,766 | 10% |
179 Properties |
| 2019 | £362,634 | -5% |
185 Properties |
| 2018 | £381,898 | 3% |
193 Properties |
| 2017 | £370,397 | 14% |
226 Properties |
| 2016 | £317,174 | -0,4% |
287 Properties |
| 2015 | £318,329 | 2% |
267 Properties |
| 2014 | £312,709 | 8% |
285 Properties |
| 2013 | £287,072 | -4% |
229 Properties |
| 2012 | £298,372 | -2% |
159 Properties |
| 2011 | £305,737 | -1% |
153 Properties |
| 2010 | £307,712 | 10% |
151 Properties |
| 2009 | £278,459 | -11% |
131 Properties |
| 2008 | £308,277 | 4% |
121 Properties |
| 2007 | £295,320 | 9% |
219 Properties |
| 2006 | £269,933 | -2% |
265 Properties |
| 2005 | £276,292 | 14% |
226 Properties |
| 2004 | £236,479 | -2% |
239 Properties |
| 2003 | £240,128 | 17% |
260 Properties |
| 2002 | £199,871 | 17% |
256 Properties |
| 2001 | £166,400 | 19% |
257 Properties |
| 2000 | £135,169 | 6% |
307 Properties |
| 1999 | £127,313 | 8% |
373 Properties |
| 1998 | £116,677 | 12% |
264 Properties |
| 1997 | £103,183 | 12% |
249 Properties |
| 1996 | £90,406 | -2% |
195 Properties |
| 1995 | £92,251 | - |
170 Properties |
Property Price per Property Type in Peterborough
Here you can find historic sold price data in order to help with your property search.
The average Property Paid Price for specific property types in the last three years are:
| Property Type | Average Sold Price | Sold Properties |
|---|---|---|
| Semi Detached House | £358,814.00 | 141 Semi Detached Houses |
| Detached House | £535,582.00 | 319 Detached Houses |
| Flat | £181,474.00 | 20 Flats |
| Terraced House | £297,189.00 | 125 Terraced Houses |