
Houses for sale & to rent in Berwick-upon-tweed, Northumberland
House Prices in Berwick-upon-tweed
Properties in Berwick-upon-tweed have an average house price of £217,127.00 and had 787 Property Transactions within the last 3 years.¹
Berwick-upon-tweed is an area in Northumberland with 7,616 households², where the most expensive property was sold for £1,325,000.00.
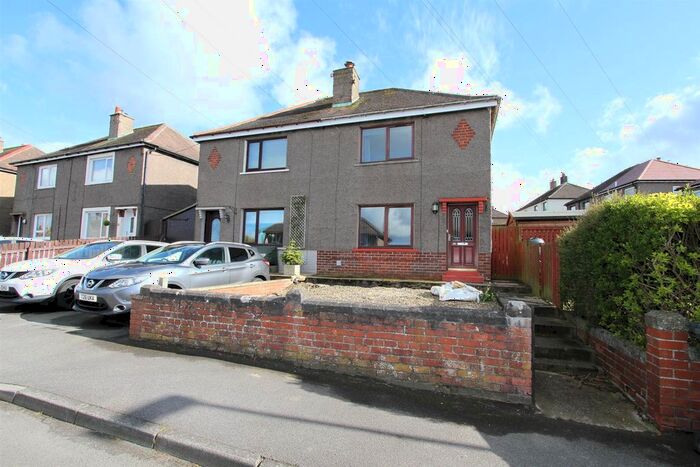
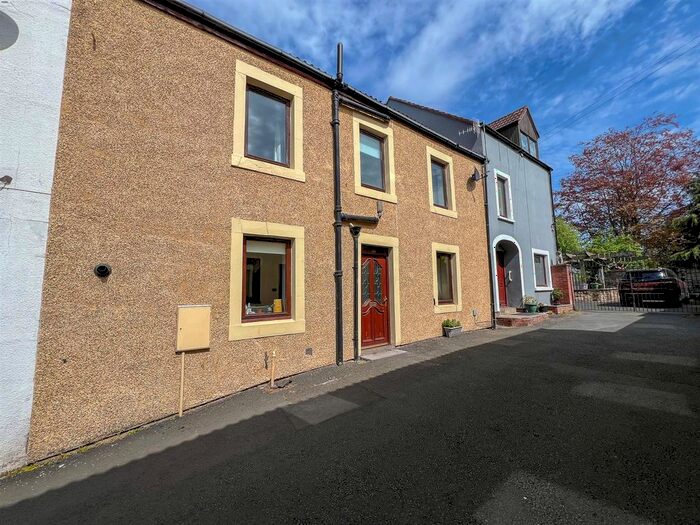
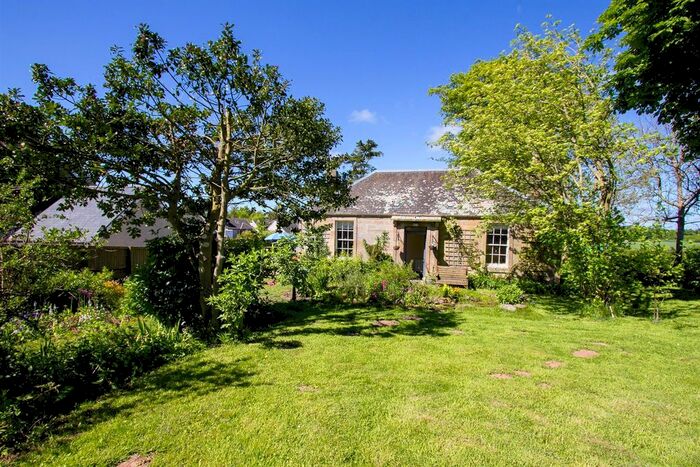
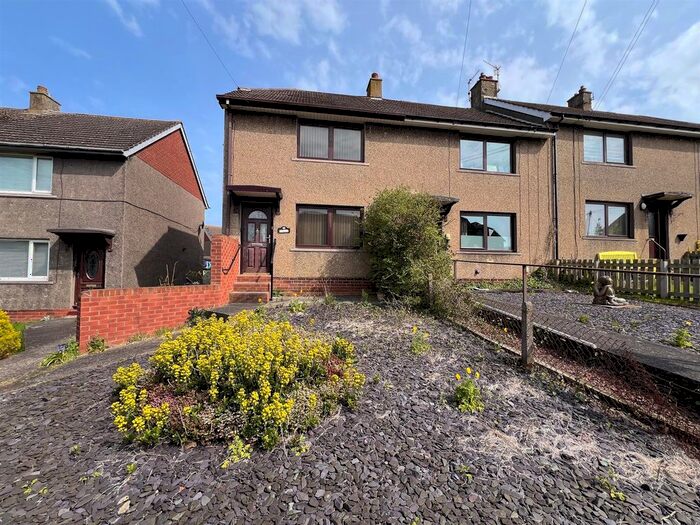
Properties for sale in Berwick-upon-tweed


Neighbourhoods in Berwick-upon-tweed
Navigate through our locations to find the location of your next house in Berwick-upon-tweed, Northumberland for sale or to rent.
Transport in Berwick-upon-tweed
Please see below transportation links in this area:

- FAQ
- Price Paid By Year
- Property Type Price
Frequently asked questions about Berwick-upon-tweed
What is the average price for a property for sale in Berwick-upon-tweed?
The average price for a property for sale in Berwick-upon-tweed is £217,127. This amount is 4% lower than the average price in Northumberland. There are 1,369 property listings for sale in Berwick-upon-tweed.
What locations have the most expensive properties for sale in Berwick-upon-tweed?
The locations with the most expensive properties for sale in Berwick-upon-tweed are Norham And Islandshires at an average of £301,176 and Berwick North at an average of £214,328.
What locations have the most affordable properties for sale in Berwick-upon-tweed?
The locations with the most affordable properties for sale in Berwick-upon-tweed are Berwick East at an average of £156,361 and Berwick West With Ord at an average of £214,250.
Which train stations are available in or near Berwick-upon-tweed?
Some of the train stations available in or near Berwick-upon-tweed are Berwick-Upon-Tweed, Chathill and Dunbar.
Property Price Paid in Berwick-upon-tweed by Year
The average sold property price by year was:
| Year | Average Sold Price | Price Change |
Sold Properties
|
|---|---|---|---|
| 2024 | £220,700 | -0,3% |
20 Properties |
| 2023 | £221,445 | -5% |
198 Properties |
| 2022 | £233,055 | 14% |
265 Properties |
| 2021 | £200,194 | 9% |
304 Properties |
| 2020 | £183,061 | 4% |
272 Properties |
| 2019 | £176,206 | -1% |
250 Properties |
| 2018 | £178,072 | 4% |
251 Properties |
| 2017 | £170,511 | 4% |
306 Properties |
| 2016 | £164,393 | -7% |
290 Properties |
| 2015 | £175,080 | 2% |
280 Properties |
| 2014 | £171,714 | 10% |
279 Properties |
| 2013 | £153,905 | -0,2% |
187 Properties |
| 2012 | £154,222 | 3% |
173 Properties |
| 2011 | £149,300 | -1% |
184 Properties |
| 2010 | £151,383 | -1% |
210 Properties |
| 2009 | £153,625 | -1% |
183 Properties |
| 2008 | £155,826 | 1% |
188 Properties |
| 2007 | £154,812 | 6% |
332 Properties |
| 2006 | £146,156 | 15% |
355 Properties |
| 2005 | £124,383 | -6% |
320 Properties |
| 2004 | £131,642 | 29% |
326 Properties |
| 2003 | £94,007 | 17% |
377 Properties |
| 2002 | £78,469 | 16% |
406 Properties |
| 2001 | £66,019 | -3% |
343 Properties |
| 2000 | £68,272 | 10% |
287 Properties |
| 1999 | £61,187 | 6% |
266 Properties |
| 1998 | £57,715 | 1% |
279 Properties |
| 1997 | £57,279 | 13% |
290 Properties |
| 1996 | £49,761 | -1% |
252 Properties |
| 1995 | £50,056 | - |
212 Properties |
Property Price per Property Type in Berwick-upon-tweed
Here you can find historic sold price data in order to help with your property search.
The average Property Paid Price for specific property types in the last three years are:
| Property Type | Average Sold Price | Sold Properties |
|---|---|---|
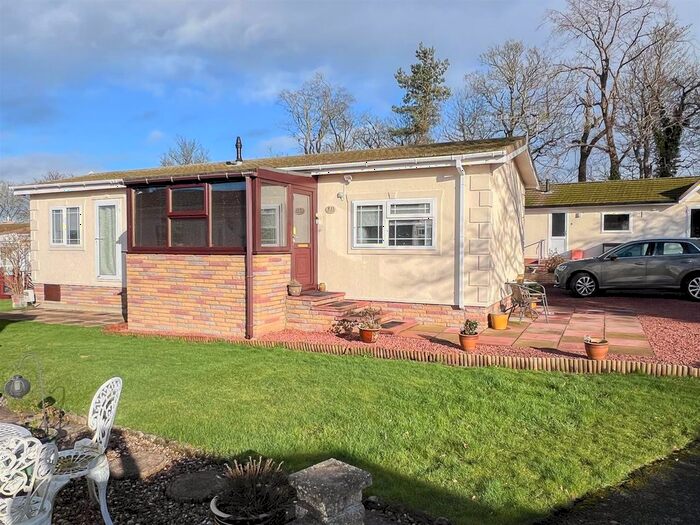
| Semi Detached House | £181,452.00 | 227 Semi Detached Houses |
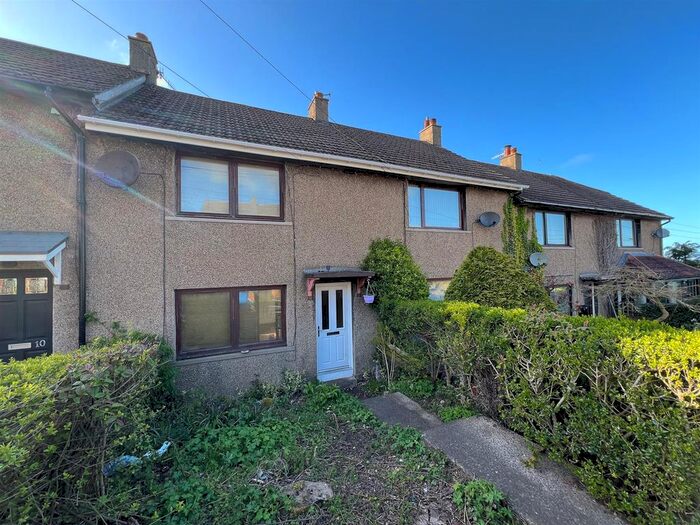
| Terraced House | £199,073.00 | 273 Terraced Houses |
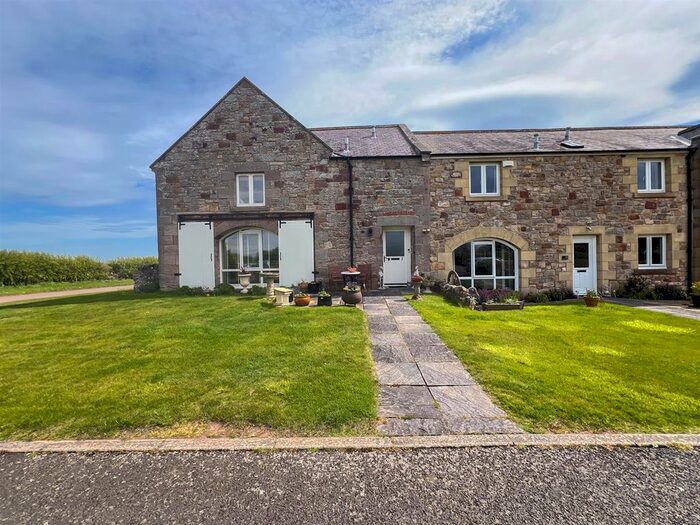
| Detached House | £351,387.00 | 175 Detached Houses |
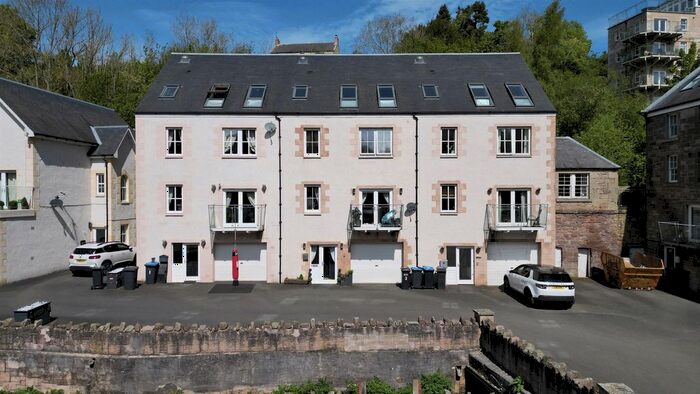
| Flat | £123,654.00 | 112 Flats |