
Houses for sale & to rent in Loughborough, Nottinghamshire
House Prices in Loughborough
Properties in Loughborough have an average house price of £327,668.00 and had 602 Property Transactions within the last 3 years.¹
Loughborough is an area in Nottinghamshire with 4,202 households², where the most expensive property was sold for £1,250,000.00.
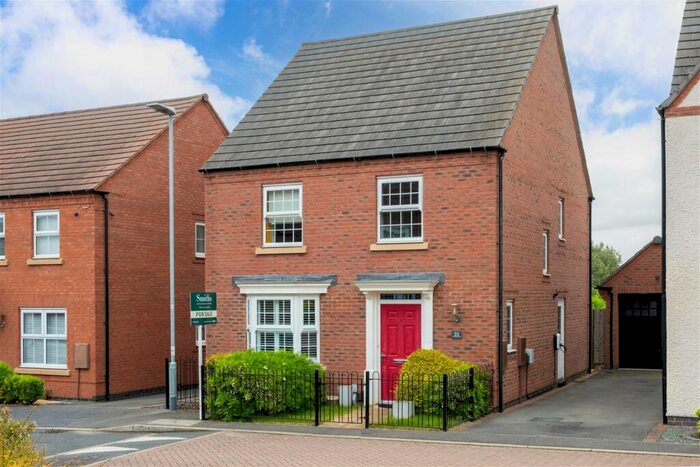
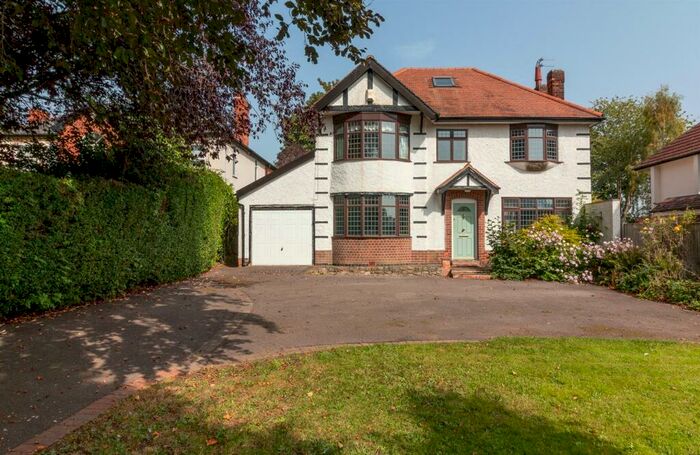
Properties for sale in Loughborough


Neighbourhoods in Loughborough
Navigate through our locations to find the location of your next house in Loughborough, Nottinghamshire for sale or to rent.
Transport in Loughborough
Please see below transportation links in this area:
-
 Loughborough Station
 -
East Midlands Parkway Station
-
Barrow-Upon-Soar Station
-
Attenborough Station
-
Long Eaton Station
-
Beeston Station
-
Sileby Station
-
Nottingham Station
- FAQ
- Price Paid By Year
- Property Type Price
Frequently asked questions about Loughborough
What is the average price for a property for sale in Loughborough?
The average price for a property for sale in Loughborough is £327,668. This amount is 29% higher than the average price in Nottinghamshire. There are more than 10,000 property listings for sale in Loughborough.
What locations have the most expensive properties for sale in Loughborough?
The locations with the most expensive properties for sale in Loughborough are Bunny at an average of £1,028,333, Keyworth & Wolds at an average of £870,500 and Wolds at an average of £454,285.
What locations have the most affordable properties for sale in Loughborough?
The locations with the most affordable properties for sale in Loughborough are Leake at an average of £289,317, Soar Valley at an average of £369,234 and Stanford at an average of £440,586.
Which train stations are available in or near Loughborough?
Some of the train stations available in or near Loughborough are Loughborough, East Midlands Parkway and Barrow-Upon-Soar.
Property Price Paid in Loughborough by Year
The average sold property price by year was:
| Year | Average Sold Price | Price Change |
Sold Properties
|
|---|---|---|---|
| 2024 | £315,772 | -11% |
11 Properties |
| 2023 | £351,429 | 6% |
147 Properties |
| 2022 | £332,096 | 6% |
175 Properties |
| 2021 | £312,289 | 0,4% |
269 Properties |
| 2020 | £311,018 | 5% |
220 Properties |
| 2019 | £295,152 | 8% |
234 Properties |
| 2018 | £271,734 | -3% |
347 Properties |
| 2017 | £280,118 | 6% |
332 Properties |
| 2016 | £262,701 | -1% |
309 Properties |
| 2015 | £264,863 | 10% |
257 Properties |
| 2014 | £239,389 | 1% |
153 Properties |
| 2013 | £237,329 | 4% |
157 Properties |
| 2012 | £228,127 | -3% |
180 Properties |
| 2011 | £235,497 | 3% |
164 Properties |
| 2010 | £229,239 | 9% |
123 Properties |
| 2009 | £208,031 | -2% |
142 Properties |
| 2008 | £212,254 | -17% |
152 Properties |
| 2007 | £249,063 | 8% |
206 Properties |
| 2006 | £228,701 | 2% |
214 Properties |
| 2005 | £224,891 | 8% |
155 Properties |
| 2004 | £207,493 | 0,4% |
149 Properties |
| 2003 | £206,765 | 27% |
163 Properties |
| 2002 | £151,438 | 13% |
171 Properties |
| 2001 | £131,812 | 5% |
158 Properties |
| 2000 | £125,158 | 14% |
227 Properties |
| 1999 | £107,481 | 9% |
274 Properties |
| 1998 | £97,283 | -4% |
186 Properties |
| 1997 | £101,494 | 3% |
185 Properties |
| 1996 | £98,917 | 22% |
108 Properties |
| 1995 | £77,111 | - |
120 Properties |
Property Price per Property Type in Loughborough
Here you can find historic sold price data in order to help with your property search.
The average Property Paid Price for specific property types in the last three years are:
| Property Type | Average Sold Price | Sold Properties |
|---|---|---|
| Flat | £170,926.00 | 25 Flats |
| Semi Detached House | £247,089.00 | 183 Semi Detached Houses |
| Terraced House | £246,237.00 | 64 Terraced Houses |
| Detached House | £400,020.00 | 330 Detached Houses |