
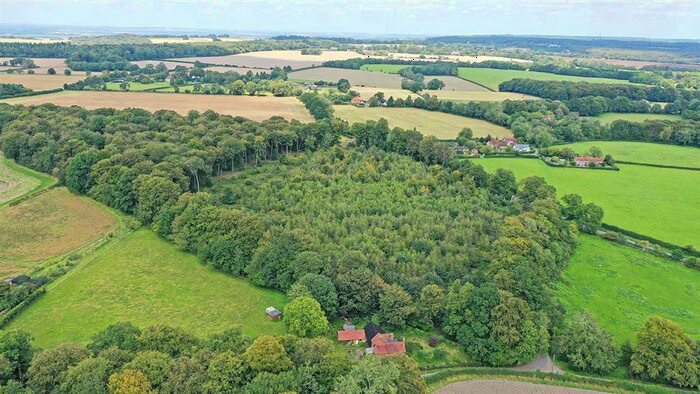
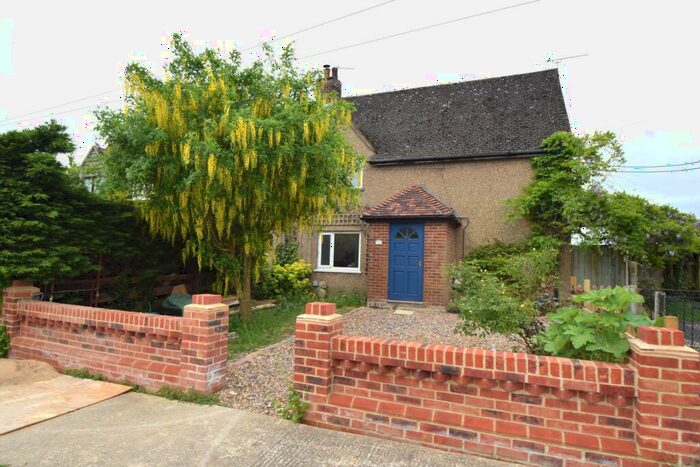
Houses for sale & to rent in Watlington, Oxfordshire
House Prices in Watlington
Properties in Watlington have an average house price of £629,232.00 and had 179 Property Transactions within the last 3 years.¹
Watlington is an area in Oxfordshire with 1,726 households², where the most expensive property was sold for £4,000,000.00.
Properties for sale in Watlington


Neighbourhoods in Watlington
Navigate through our locations to find the location of your next house in Watlington, Oxfordshire for sale or to rent.
Transport in Watlington
Please see below transportation links in this area:
-
 Saunderton Station
 -
Princes Risborough Station
-
Haddenham and Thame Parkway Station
-
Cholsey Station
-
Henley-On-Thames Station
-
Monks Risborough Station
- FAQ
- Price Paid By Year
- Property Type Price
Frequently asked questions about Watlington
What is the average price for a property for sale in Watlington?
The average price for a property for sale in Watlington is £629,232. This amount is 28% higher than the average price in Oxfordshire. There are 628 property listings for sale in Watlington.
What locations have the most expensive properties for sale in Watlington?
The locations with the most expensive properties for sale in Watlington are Aston Rowant at an average of £1,155,793 and Benson at an average of £1,001,000.
What locations have the most affordable properties for sale in Watlington?
The locations with the most affordable properties for sale in Watlington are Watlington at an average of £551,984 and Haseley Brook at an average of £815,500.
Which train stations are available in or near Watlington?
Some of the train stations available in or near Watlington are Saunderton, Princes Risborough and Haddenham and Thame Parkway.
Property Price Paid in Watlington by Year
The average sold property price by year was:
| Year | Average Sold Price | Price Change |
Sold Properties
|
|---|---|---|---|
| 2024 | £445,500 | -92% |
4 Properties |
| 2023 | £856,953 | 39% |
32 Properties |
| 2022 | £520,621 | -22% |
66 Properties |
| 2021 | £637,236 | -3% |
77 Properties |
| 2020 | £655,691 | 22% |
60 Properties |
| 2019 | £513,000 | -19% |
66 Properties |
| 2018 | £610,162 | 17% |
43 Properties |
| 2017 | £507,786 | -7% |
69 Properties |
| 2016 | £541,827 | 27% |
70 Properties |
| 2015 | £395,688 | -17% |
59 Properties |
| 2014 | £464,372 | 1% |
86 Properties |
| 2013 | £459,009 | 9% |
55 Properties |
| 2012 | £416,446 | 12% |
50 Properties |
| 2011 | £366,766 | -9% |
51 Properties |
| 2010 | £398,313 | -26% |
55 Properties |
| 2009 | £503,396 | 36% |
42 Properties |
| 2008 | £319,795 | -28% |
41 Properties |
| 2007 | £410,590 | 8% |
87 Properties |
| 2006 | £376,555 | 10% |
98 Properties |
| 2005 | £340,595 | 8% |
76 Properties |
| 2004 | £314,357 | -1% |
89 Properties |
| 2003 | £318,536 | 6% |
90 Properties |
| 2002 | £299,957 | 23% |
95 Properties |
| 2001 | £229,652 | 2% |
103 Properties |
| 2000 | £225,884 | 24% |
82 Properties |
| 1999 | £172,689 | -11% |
92 Properties |
| 1998 | £191,805 | 27% |
89 Properties |
| 1997 | £139,700 | -2% |
108 Properties |
| 1996 | £142,565 | 20% |
117 Properties |
| 1995 | £114,519 | - |
79 Properties |
Property Price per Property Type in Watlington
Here you can find historic sold price data in order to help with your property search.
The average Property Paid Price for specific property types in the last three years are:
| Property Type | Average Sold Price | Sold Properties |
|---|---|---|
| Semi Detached House | £494,744.00 | 56 Semi Detached Houses |
| Terraced House | £463,365.00 | 52 Terraced Houses |
| Flat | £264,213.00 | 14 Flats |
| Detached House | £1,002,333.00 | 57 Detached Houses |