
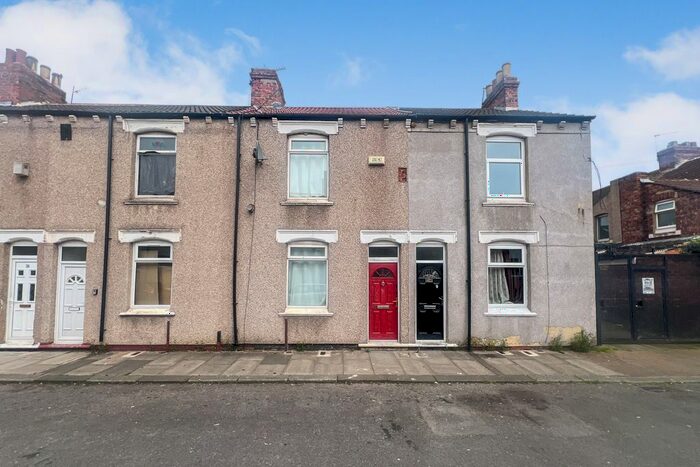
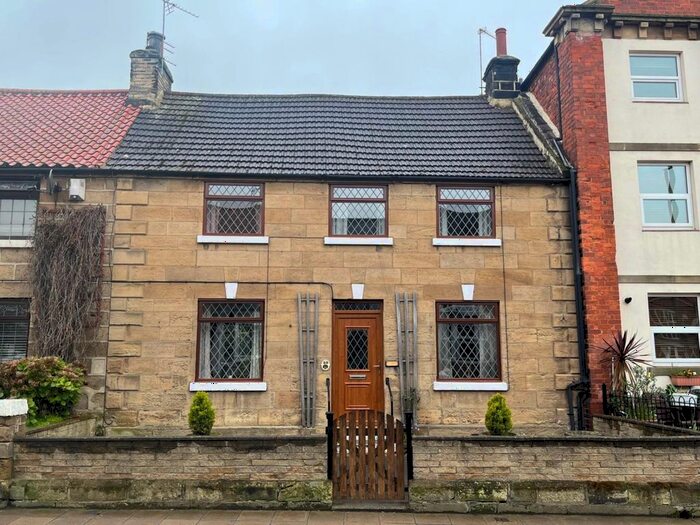
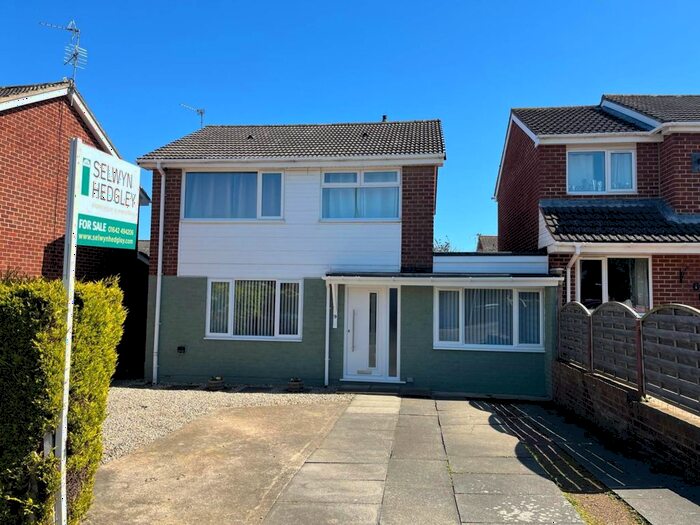
Houses for sale & to rent in Redcar and Cleveland, England
House Prices in Redcar and Cleveland
Properties in Redcar and Cleveland have
an average house price of
£155,039.00
and had 6,875 Property Transactions
within the last 3 years.¹
Redcar and Cleveland is a location in
England with
59,431 households², where the most expensive property was sold for £1,350,000.00.
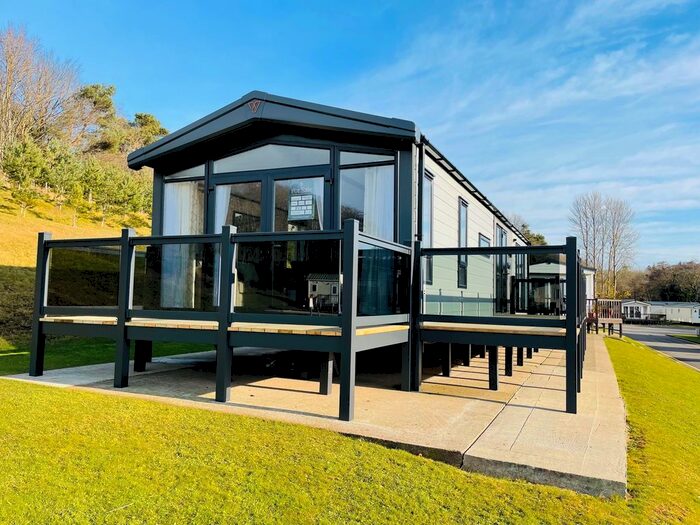
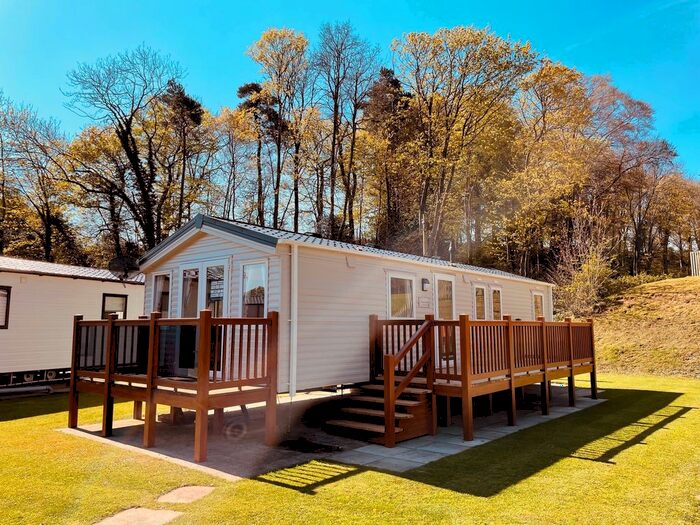
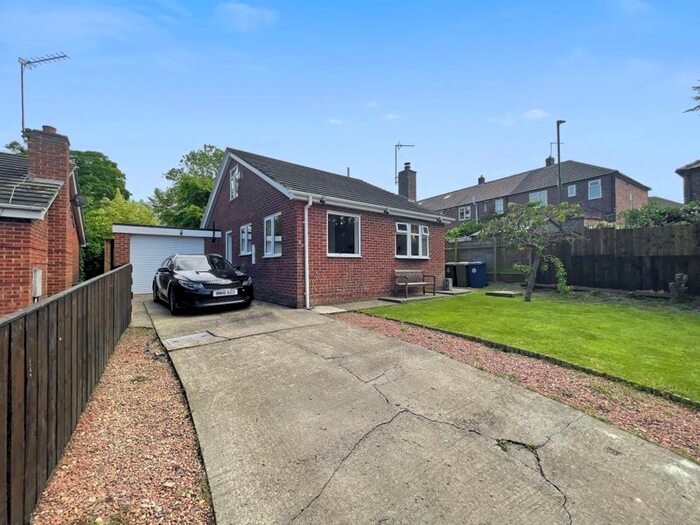
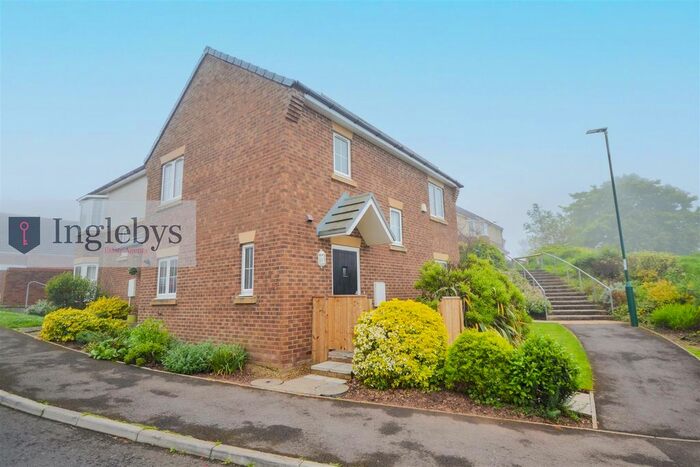
Properties for sale in Redcar and Cleveland


Towns in Redcar and Cleveland
Navigate through our locations to find the location of your next house in Redcar and Cleveland, England for sale or to rent.
Transport in Redcar and Cleveland
Please see below transportation links in this area:

- FAQ
- Price Paid By Year
- Property Type Price
Frequently asked questions about Redcar and Cleveland
What is the average price for a property for sale in Redcar and Cleveland?
The average price for a property for sale in Redcar and Cleveland is £155,039. This amount is 78% lower than the average price in England. There are 9,644 property listings for sale in Redcar and Cleveland.
What locations have the most expensive properties for sale in Redcar and Cleveland?
The locations with the most expensive properties for sale in Redcar and Cleveland are Guisborough at an average of £192,702 and Saltburn-by-the-sea at an average of £155,611.
What locations have the most affordable properties for sale in Redcar and Cleveland?
The locations with the most affordable properties for sale in Redcar and Cleveland are Middlesbrough at an average of £137,484 and Redcar at an average of £152,300.
Which train stations are available in or near Redcar and Cleveland?
Some of the train stations available in or near Redcar and Cleveland are Longbeck, Marske and Redcar East.
Property Price Paid in Redcar and Cleveland by Year
The average sold property price by year was:
| Year | Average Sold Price | Price Change |
Sold Properties
|
|---|---|---|---|
| 2024 | £152,433 | -4% |
87 Properties |
| 2023 | £159,124 | 1% |
1,718 Properties |
| 2022 | £158,187 | 5% |
2,289 Properties |
| 2021 | £150,006 | 6% |
2,781 Properties |
| 2020 | £140,659 | 1% |
1,986 Properties |
| 2019 | £139,288 | 0,2% |
2,395 Properties |
| 2018 | £139,077 | 2% |
2,330 Properties |
| 2017 | £135,840 | -1% |
2,249 Properties |
| 2016 | £136,607 | 2% |
2,076 Properties |
| 2015 | £133,350 | 3% |
1,978 Properties |
| 2014 | £129,397 | 0,5% |
2,004 Properties |
| 2013 | £128,811 | 3% |
1,640 Properties |
| 2012 | £125,494 | 2% |
1,371 Properties |
| 2011 | £123,248 | -4% |
1,439 Properties |
| 2010 | £128,067 | 1% |
1,277 Properties |
| 2009 | £126,925 | -1% |
1,223 Properties |
| 2008 | £128,705 | -4% |
1,481 Properties |
| 2007 | £133,732 | 4% |
2,925 Properties |
| 2006 | £128,162 | 8% |
3,147 Properties |
| 2005 | £118,543 | 13% |
2,369 Properties |
| 2004 | £103,559 | 19% |
2,758 Properties |
| 2003 | £84,292 | 17% |
3,305 Properties |
| 2002 | £69,845 | 15% |
3,534 Properties |
| 2001 | £59,696 | 7% |
2,790 Properties |
| 2000 | £55,306 | 5% |
2,232 Properties |
| 1999 | £52,493 | 2% |
2,017 Properties |
| 1998 | £51,229 | 3% |
1,906 Properties |
| 1997 | £49,476 | 3% |
1,940 Properties |
| 1996 | £47,790 | 2% |
1,951 Properties |
| 1995 | £47,021 | - |
1,684 Properties |
Property Price per Property Type in Redcar and Cleveland
Here you can find historic sold price data in order to help with your property search.
The average Property Paid Price for specific property types in the last three years are:
| Property Type | Average Sold Price | Sold Properties |
|---|---|---|
| Terraced House | £100,036.00 | 2,304 Terraced Houses |
| Flat | £99,992.00 | 355 Flats |
| Semi Detached House | £150,961.00 | 2,869 Semi Detached Houses |
| Detached House | £272,313.00 | 1,347 Detached Houses |