
Houses for sale & to rent in Burnham-on-sea, Somerset
House Prices in Burnham-on-sea
Properties in Burnham-on-sea have an average house price of £272,569.00 and had 1,072 Property Transactions within the last 3 years.¹
Burnham-on-sea is an area in Somerset with 7,649 households², where the most expensive property was sold for £1,150,000.00.
Properties for sale in Burnham-on-sea


Neighbourhoods in Burnham-on-sea
Navigate through our locations to find the location of your next house in Burnham-on-sea, Somerset for sale or to rent.
Transport in Burnham-on-sea
Please see below transportation links in this area:
-
 Highbridge and Burnham Station
 -
Weston-Super-Mare Station
-
Weston Milton Station
-
Bridgwater Station
-
Worle Station
- FAQ
- Price Paid By Year
- Property Type Price
Frequently asked questions about Burnham-on-sea
What is the average price for a property for sale in Burnham-on-sea?
The average price for a property for sale in Burnham-on-sea is £272,569. This amount is 16% lower than the average price in Somerset. There are 977 property listings for sale in Burnham-on-sea.
What locations have the most expensive properties for sale in Burnham-on-sea?
The locations with the most expensive properties for sale in Burnham-on-sea are Burnham North at an average of £295,058 and Berrow at an average of £272,596.
What locations have the most affordable properties for sale in Burnham-on-sea?
The locations with the most affordable properties for sale in Burnham-on-sea are Burnham Central at an average of £250,287 and Highbridge And Burnham Marine at an average of £269,444.
Which train stations are available in or near Burnham-on-sea?
Some of the train stations available in or near Burnham-on-sea are Highbridge and Burnham, Weston-Super-Mare and Weston Milton.
Property Price Paid in Burnham-on-sea by Year
The average sold property price by year was:
| Year | Average Sold Price | Price Change |
Sold Properties
|
|---|---|---|---|
| 2024 | £283,998 | 1% |
31 Properties |
| 2023 | £280,921 | - |
257 Properties |
| 2022 | £280,924 | 7% |
326 Properties |
| 2021 | £261,161 | 9% |
458 Properties |
| 2020 | £237,743 | 3% |
315 Properties |
| 2019 | £231,211 | -4% |
316 Properties |
| 2018 | £240,605 | 6% |
410 Properties |
| 2017 | £225,509 | 7% |
378 Properties |
| 2016 | £209,378 | 6% |
403 Properties |
| 2015 | £196,816 | 5% |
403 Properties |
| 2014 | £187,709 | 5% |
421 Properties |
| 2013 | £178,444 | -2% |
353 Properties |
| 2012 | £182,567 | 5% |
274 Properties |
| 2011 | £173,147 | - |
323 Properties |
| 2010 | £173,087 | 8% |
284 Properties |
| 2009 | £158,950 | -18% |
313 Properties |
| 2008 | £187,054 | -2% |
257 Properties |
| 2007 | £190,317 | 4% |
518 Properties |
| 2006 | £183,492 | 7% |
636 Properties |
| 2005 | £170,689 | 3% |
450 Properties |
| 2004 | £165,854 | 14% |
533 Properties |
| 2003 | £142,668 | 13% |
595 Properties |
| 2002 | £124,062 | 20% |
654 Properties |
| 2001 | £99,452 | 7% |
685 Properties |
| 2000 | £92,390 | 15% |
627 Properties |
| 1999 | £78,781 | 17% |
697 Properties |
| 1998 | £65,536 | 2% |
560 Properties |
| 1997 | £64,406 | 9% |
533 Properties |
| 1996 | £58,302 | 5% |
491 Properties |
| 1995 | £55,609 | - |
389 Properties |
Property Price per Property Type in Burnham-on-sea
Here you can find historic sold price data in order to help with your property search.
The average Property Paid Price for specific property types in the last three years are:
| Property Type | Average Sold Price | Sold Properties |
|---|---|---|
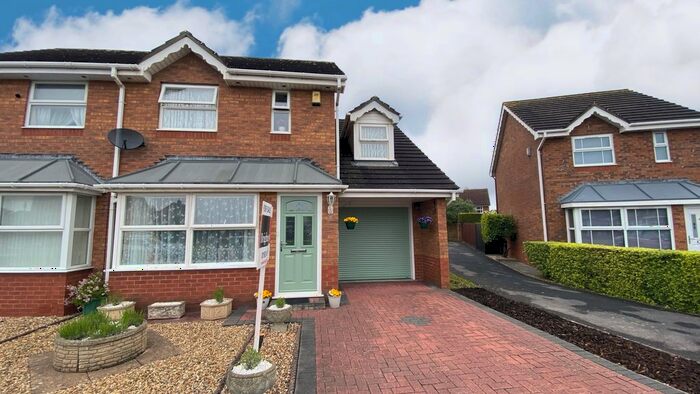
| Semi Detached House | £272,978.00 | 337 Semi Detached Houses |
| Terraced House | £221,451.00 | 196 Terraced Houses |
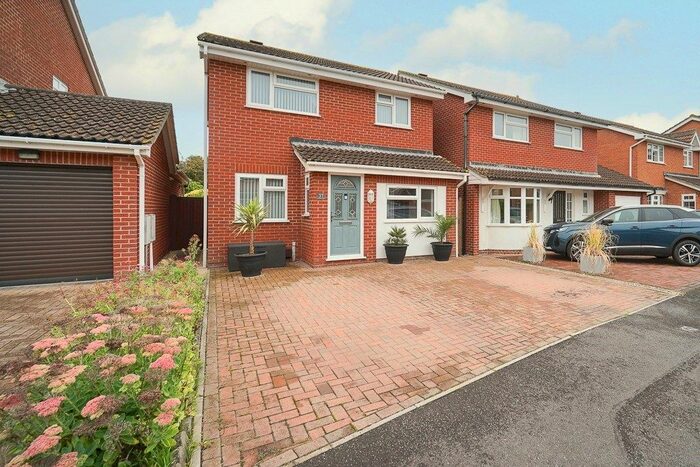
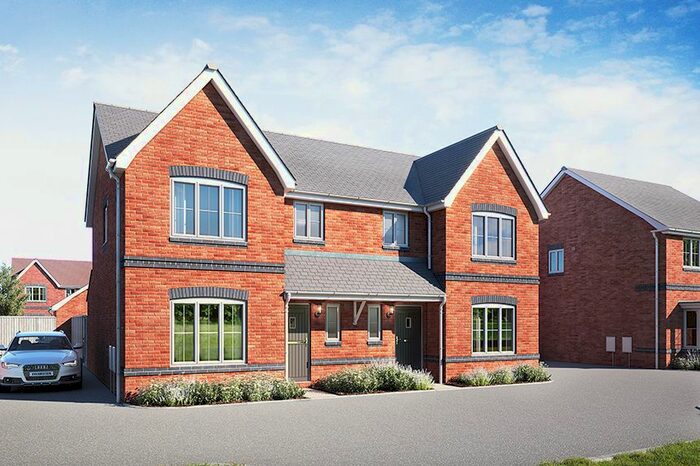
| Detached House | £370,468.00 | 357 Detached Houses |
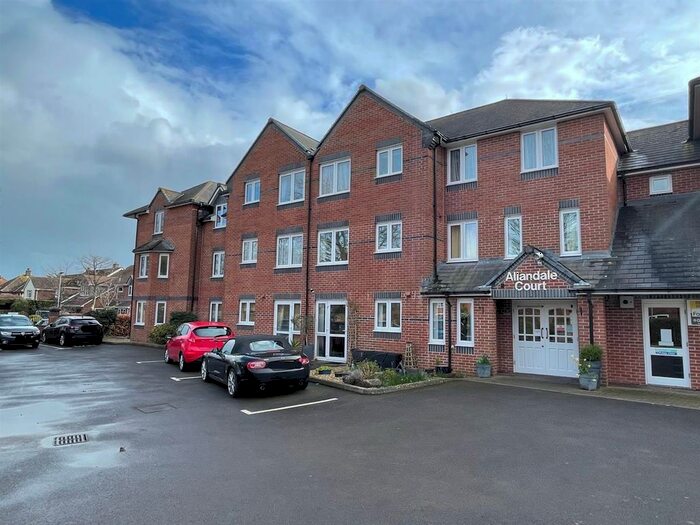
| Flat | £134,828.00 | 182 Flats |