
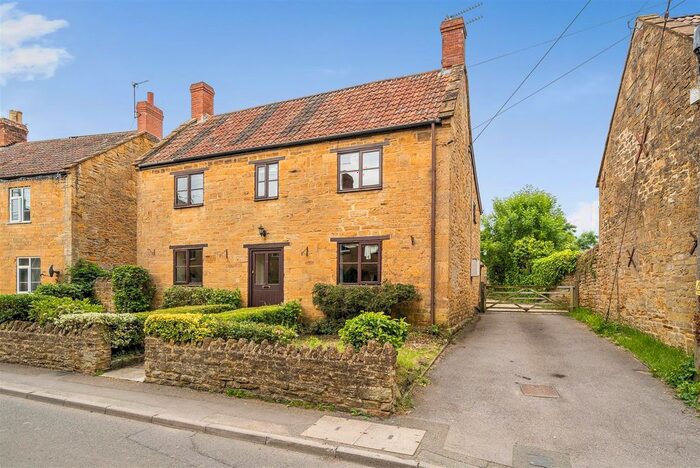
Houses for sale & to rent in Crewkerne, Somerset
House Prices in Crewkerne
Properties in Crewkerne have an average house price of £278,965.00 and had 576 Property Transactions within the last 3 years.¹
Crewkerne is an area in Somerset with 4,530 households², where the most expensive property was sold for £3,285,000.00.
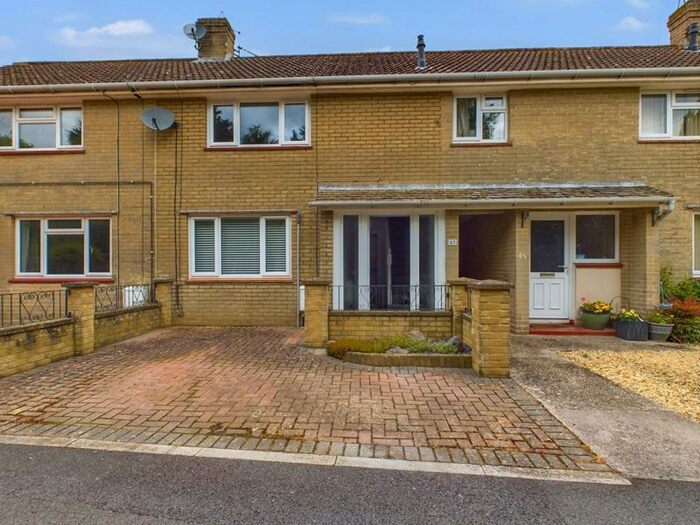
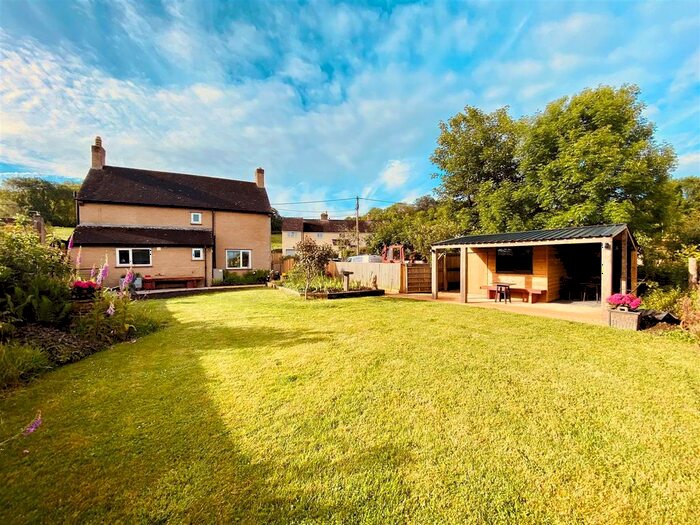
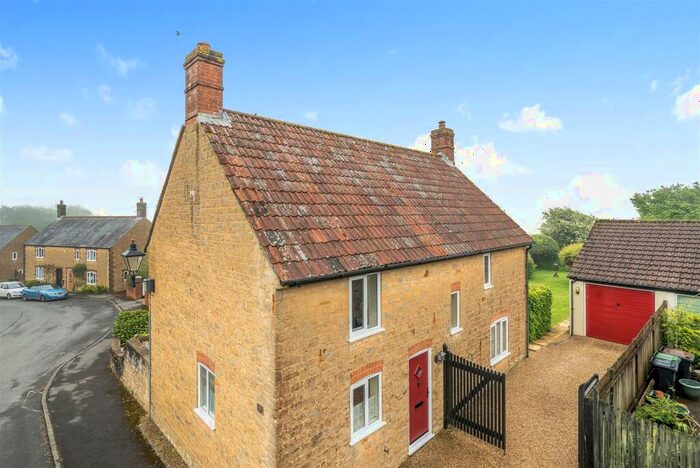
Properties for sale in Crewkerne


Neighbourhoods in Crewkerne
Navigate through our locations to find the location of your next house in Crewkerne, Somerset for sale or to rent.
Transport in Crewkerne
Please see below transportation links in this area:
-
 Crewkerne Station
 -
Yeovil Junction Station
-
Yeovil Pen Mill Station
-
Thornford Station
-
Yetminster Station
-
Chetnole Station
- FAQ
- Price Paid By Year
- Property Type Price
Frequently asked questions about Crewkerne
What is the average price for a property for sale in Crewkerne?
The average price for a property for sale in Crewkerne is £278,965. This amount is 14% lower than the average price in Somerset. There are 1,811 property listings for sale in Crewkerne.
What locations have the most expensive properties for sale in Crewkerne?
The locations with the most expensive properties for sale in Crewkerne are Windwhistle at an average of £450,666 and Parrett at an average of £429,959.
What locations have the most affordable properties for sale in Crewkerne?
The location with the most affordable properties for sale in Crewkerne is Crewkerne at an average of £252,788.
Which train stations are available in or near Crewkerne?
Some of the train stations available in or near Crewkerne are Crewkerne, Yeovil Junction and Yeovil Pen Mill.
Property Price Paid in Crewkerne by Year
The average sold property price by year was:
| Year | Average Sold Price | Price Change |
Sold Properties
|
|---|---|---|---|
| 2024 | £303,562 | 14% |
16 Properties |
| 2023 | £261,213 | -15% |
140 Properties |
| 2022 | £301,636 | 11% |
187 Properties |
| 2021 | £269,748 | 10% |
233 Properties |
| 2020 | £243,995 | 4% |
198 Properties |
| 2019 | £234,012 | 5% |
172 Properties |
| 2018 | £222,110 | 10% |
219 Properties |
| 2017 | £200,580 | -6% |
231 Properties |
| 2016 | £213,450 | 6% |
246 Properties |
| 2015 | £200,264 | 5% |
256 Properties |
| 2014 | £190,171 | -2% |
247 Properties |
| 2013 | £193,735 | 10% |
216 Properties |
| 2012 | £174,041 | -18% |
173 Properties |
| 2011 | £205,519 | 4% |
164 Properties |
| 2010 | £196,452 | 6% |
177 Properties |
| 2009 | £184,595 | -12% |
158 Properties |
| 2008 | £206,941 | 5% |
161 Properties |
| 2007 | £196,858 | 9% |
297 Properties |
| 2006 | £178,409 | 8% |
309 Properties |
| 2005 | £163,488 | -15% |
206 Properties |
| 2004 | £188,522 | 21% |
195 Properties |
| 2003 | £148,361 | 12% |
205 Properties |
| 2002 | £130,325 | 14% |
268 Properties |
| 2001 | £111,684 | 11% |
269 Properties |
| 2000 | £98,842 | 21% |
213 Properties |
| 1999 | £78,057 | 3% |
277 Properties |
| 1998 | £76,055 | 12% |
252 Properties |
| 1997 | £67,114 | 12% |
245 Properties |
| 1996 | £58,759 | -8% |
208 Properties |
| 1995 | £63,223 | - |
197 Properties |
Property Price per Property Type in Crewkerne
Here you can find historic sold price data in order to help with your property search.
The average Property Paid Price for specific property types in the last three years are:
| Property Type | Average Sold Price | Sold Properties |
|---|---|---|
| Semi Detached House | £271,078.00 | 144 Semi Detached Houses |
| Terraced House | £197,275.00 | 198 Terraced Houses |
| Detached House | £436,078.00 | 168 Detached Houses |
| Flat | £141,321.00 | 66 Flats |