
Houses for sale & to rent in Chippenham, South Gloucestershire
House Prices in Chippenham
Properties in Chippenham have an average house price of £616,512.00 and had 90 Property Transactions within the last 3 years.¹
Chippenham is an area in South Gloucestershire with 926 households², where the most expensive property was sold for £3,212,400.00.
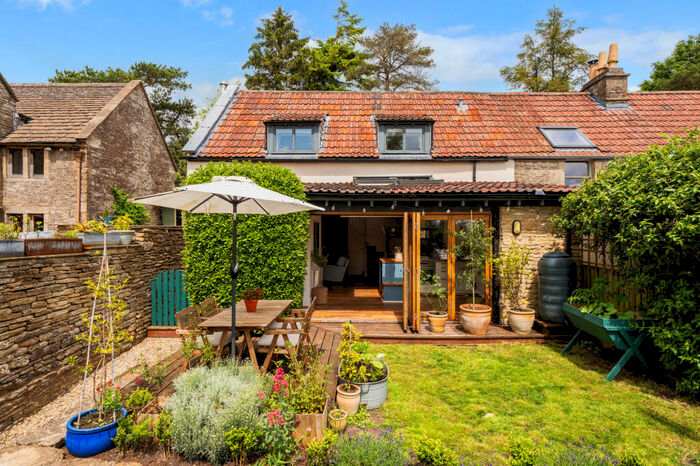
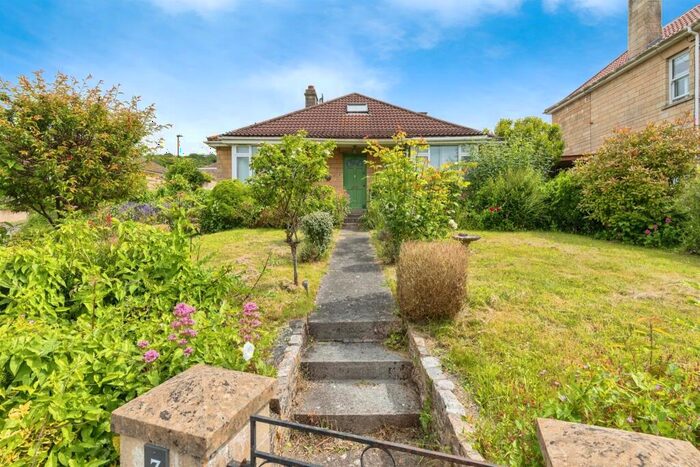
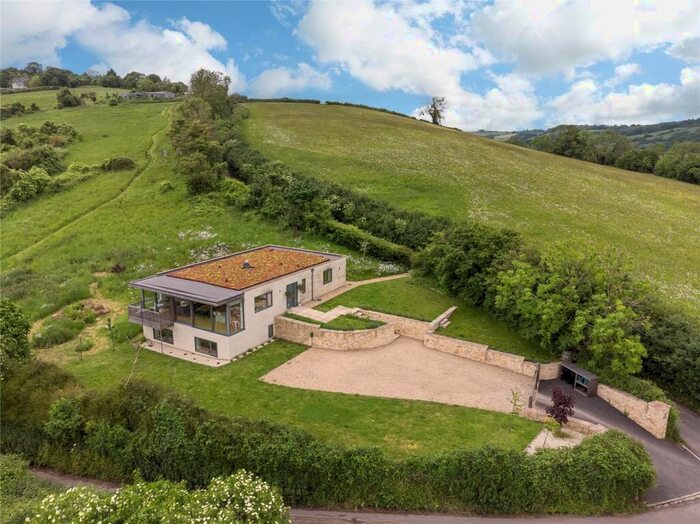
Properties for sale in Chippenham


Neighbourhoods in Chippenham
Navigate through our locations to find the location of your next house in Chippenham, South Gloucestershire for sale or to rent.
Transport in Chippenham
Please see below transportation links in this area:
-
 Bath Spa Station
 -
Oldfield Park Station
-
Yate Station
-
Keynsham Station
-
Freshford Station
-
Avoncliff Station
-
Bradford-On-Avon Station
-
Chippenham Station
-
Bristol Parkway Station
-
Lawrence Hill Station
- FAQ
- Price Paid By Year
- Property Type Price
Frequently asked questions about Chippenham
What is the average price for a property for sale in Chippenham?
The average price for a property for sale in Chippenham is £616,512. This amount is 57% higher than the average price in South Gloucestershire. There are 1,587 property listings for sale in Chippenham.
What locations have the most expensive properties for sale in Chippenham?
The location with the most expensive properties for sale in Chippenham is Cotswold Edge at an average of £1,431,666.
What locations have the most affordable properties for sale in Chippenham?
The location with the most affordable properties for sale in Chippenham is Boyd Valley at an average of £588,403.
Which train stations are available in or near Chippenham?
Some of the train stations available in or near Chippenham are Bath Spa, Oldfield Park and Yate.
Property Price Paid in Chippenham by Year
The average sold property price by year was:
| Year | Average Sold Price | Price Change |
Sold Properties
|
|---|---|---|---|
| 2024 | £352,000 | -85% |
5 Properties |
| 2023 | £649,676 | 27% |
17 Properties |
| 2022 | £472,578 | -46% |
19 Properties |
| 2021 | £687,808 | 25% |
49 Properties |
| 2020 | £513,346 | 13% |
13 Properties |
| 2019 | £448,597 | -2% |
27 Properties |
| 2018 | £458,440 | -21% |
25 Properties |
| 2017 | £553,863 | 23% |
27 Properties |
| 2016 | £429,096 | 17% |
29 Properties |
| 2015 | £358,000 | -36% |
25 Properties |
| 2014 | £485,610 | 13% |
40 Properties |
| 2013 | £423,107 | 11% |
35 Properties |
| 2012 | £376,217 | -4% |
28 Properties |
| 2011 | £392,250 | 8% |
26 Properties |
| 2010 | £361,880 | 9% |
33 Properties |
| 2009 | £328,084 | -0,4% |
23 Properties |
| 2008 | £329,350 | -4% |
30 Properties |
| 2007 | £340,939 | 9% |
34 Properties |
| 2006 | £308,925 | -10% |
34 Properties |
| 2005 | £338,498 | 6% |
33 Properties |
| 2004 | £319,518 | -8% |
49 Properties |
| 2003 | £344,648 | 20% |
40 Properties |
| 2002 | £275,033 | 24% |
43 Properties |
| 2001 | £209,835 | 21% |
51 Properties |
| 2000 | £165,672 | 16% |
75 Properties |
| 1999 | £139,380 | 18% |
34 Properties |
| 1998 | £114,985 | 5% |
34 Properties |
| 1997 | £109,225 | 1% |
40 Properties |
| 1996 | £108,653 | 11% |
34 Properties |
| 1995 | £96,260 | - |
23 Properties |
Property Price per Property Type in Chippenham
Here you can find historic sold price data in order to help with your property search.
The average Property Paid Price for specific property types in the last three years are:
| Property Type | Average Sold Price | Sold Properties |
|---|---|---|
| Semi Detached House | £466,555.00 | 18 Semi Detached Houses |
| Terraced House | £552,635.00 | 42 Terraced Houses |
| Flat | £307,857.00 | 7 Flats |
| Detached House | £944,452.00 | 23 Detached Houses |