
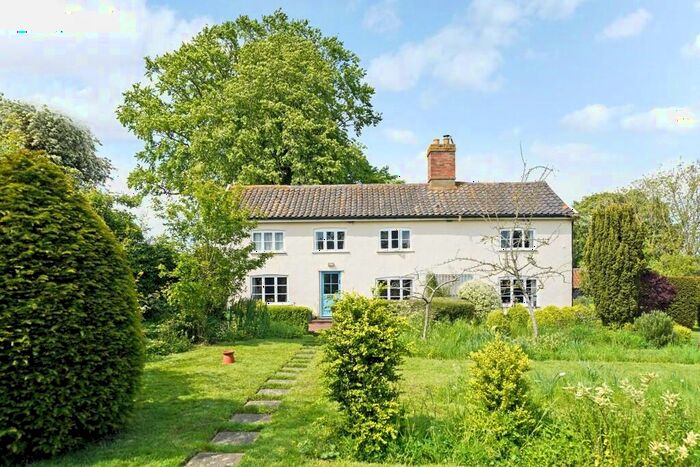
Houses for sale & to rent in Eye, Suffolk
House Prices in Eye
Properties in Eye have an average house price of £393,940.00 and had 579 Property Transactions within the last 3 years.¹
Eye is an area in Suffolk with 4,698 households², where the most expensive property was sold for £1,603,000.00.
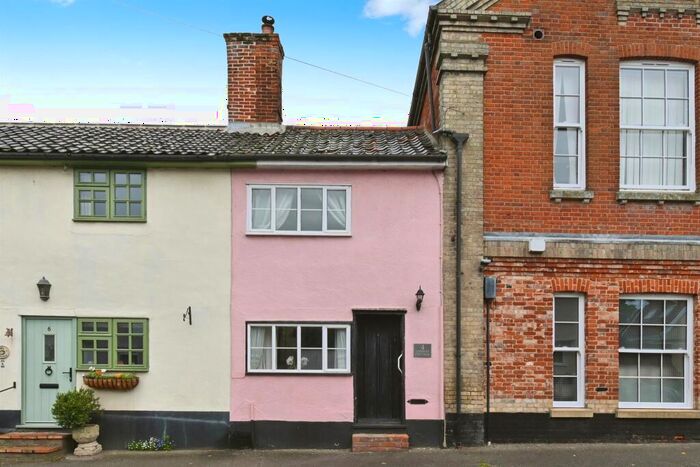
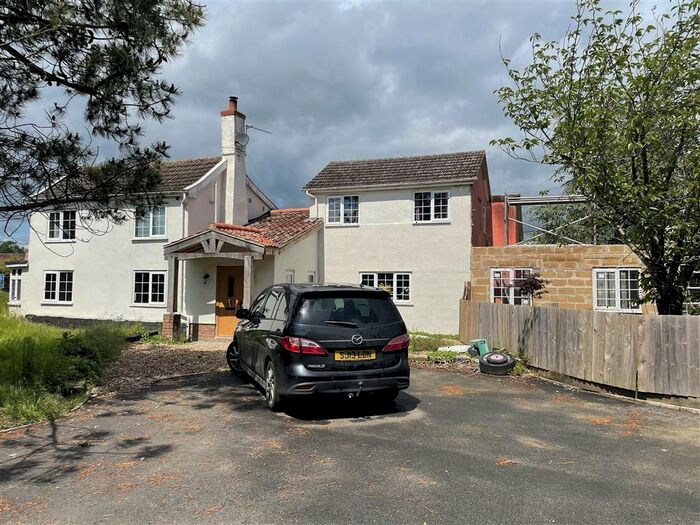
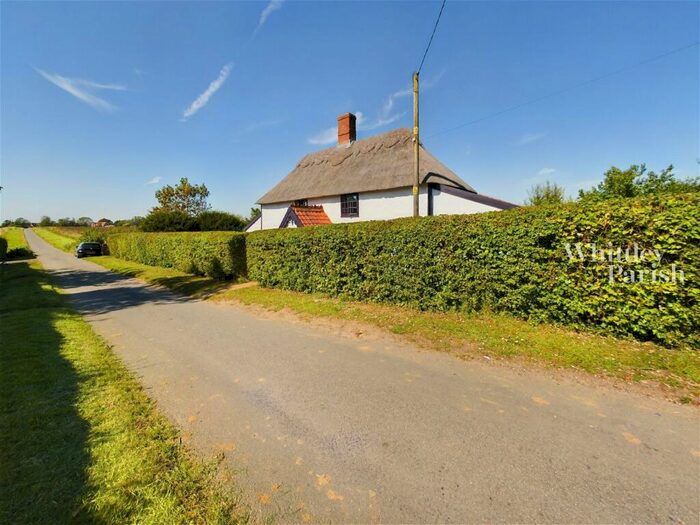
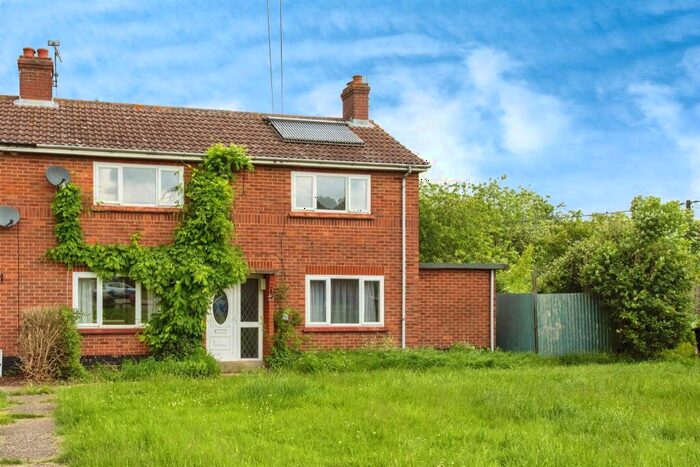
Properties for sale in Eye


Neighbourhoods in Eye
Navigate through our locations to find the location of your next house in Eye, Suffolk for sale or to rent.
Transport in Eye
Please see below transportation links in this area:
-
 Diss Station
 -
Stowmarket Station
-
Elmswell Station
-
Needham Market Station
-
Eccles Road Station
-
Halesworth Station
-
Harling Road Station
-
Wickham Market Station
- FAQ
- Price Paid By Year
- Property Type Price
Frequently asked questions about Eye
What is the average price for a property for sale in Eye?
The average price for a property for sale in Eye is £393,940. This amount is 20% higher than the average price in Suffolk. There are 5,494 property listings for sale in Eye.
What locations have the most expensive properties for sale in Eye?
The locations with the most expensive properties for sale in Eye are Hoxne at an average of £476,071, Wetheringsett at an average of £446,697 and Palgrave at an average of £442,236.
What locations have the most affordable properties for sale in Eye?
The locations with the most affordable properties for sale in Eye are Mendlesham at an average of £296,460, Eye at an average of £318,327 and Stradbroke And Laxfield at an average of £363,864.
Which train stations are available in or near Eye?
Some of the train stations available in or near Eye are Diss, Stowmarket and Elmswell.
Property Price Paid in Eye by Year
The average sold property price by year was:
| Year | Average Sold Price | Price Change |
Sold Properties
|
|---|---|---|---|
| 2024 | £364,967 | -13% |
12 Properties |
| 2023 | £411,009 | - |
122 Properties |
| 2022 | £411,023 | 8% |
156 Properties |
| 2021 | £378,717 | 8% |
289 Properties |
| 2020 | £348,031 | -2% |
200 Properties |
| 2019 | £354,845 | 7% |
167 Properties |
| 2018 | £331,694 | -2% |
172 Properties |
| 2017 | £337,754 | 17% |
174 Properties |
| 2016 | £281,679 | 5% |
191 Properties |
| 2015 | £266,784 | -4% |
224 Properties |
| 2014 | £277,176 | 7% |
220 Properties |
| 2013 | £256,408 | 13% |
163 Properties |
| 2012 | £222,047 | -7% |
165 Properties |
| 2011 | £238,565 | -12% |
144 Properties |
| 2010 | £267,122 | 9% |
172 Properties |
| 2009 | £244,348 | -13% |
173 Properties |
| 2008 | £276,372 | 3% |
138 Properties |
| 2007 | £266,943 | 11% |
264 Properties |
| 2006 | £237,535 | 6% |
286 Properties |
| 2005 | £224,087 | 3% |
203 Properties |
| 2004 | £217,325 | 8% |
245 Properties |
| 2003 | £200,203 | 16% |
241 Properties |
| 2002 | £169,131 | 20% |
286 Properties |
| 2001 | £135,800 | 12% |
273 Properties |
| 2000 | £120,108 | 20% |
251 Properties |
| 1999 | £96,385 | 6% |
241 Properties |
| 1998 | £90,638 | 4% |
229 Properties |
| 1997 | £87,104 | 15% |
254 Properties |
| 1996 | £74,118 | 4% |
206 Properties |
| 1995 | £71,460 | - |
157 Properties |
Property Price per Property Type in Eye
Here you can find historic sold price data in order to help with your property search.
The average Property Paid Price for specific property types in the last three years are:
| Property Type | Average Sold Price | Sold Properties |
|---|---|---|
| Semi Detached House | £282,181.00 | 127 Semi Detached Houses |
| Terraced House | £252,344.00 | 102 Terraced Houses |
| Detached House | £483,351.00 | 341 Detached Houses |
| Flat | £188,055.00 | 9 Flats |