
Houses for sale & to rent in Leiston, Suffolk
House Prices in Leiston
Properties in Leiston have an average house price of £313,376.00 and had 400 Property Transactions within the last 3 years.¹
Leiston is an area in Suffolk with 2,927 households², where the most expensive property was sold for £2,247,500.00.
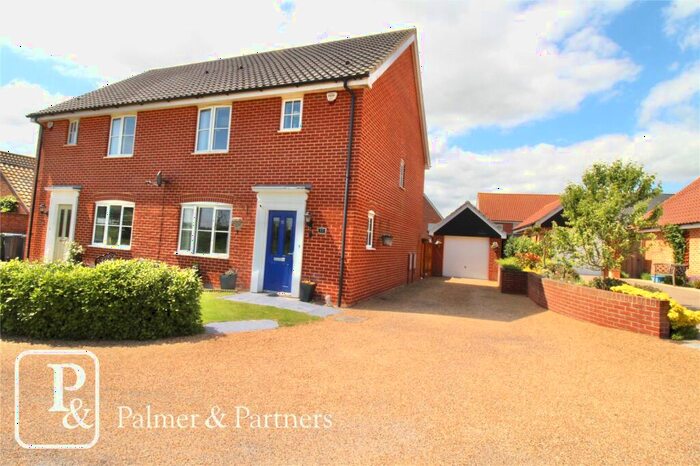
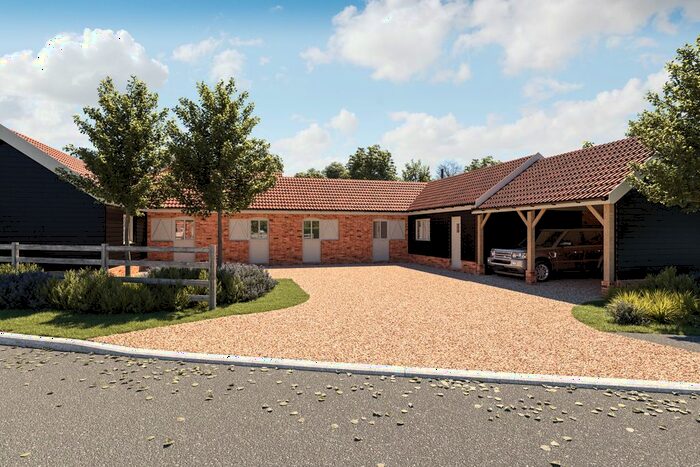
Properties for sale in Leiston


Neighbourhoods in Leiston
Navigate through our locations to find the location of your next house in Leiston, Suffolk for sale or to rent.
Transport in Leiston
Please see below transportation links in this area:

- FAQ
- Price Paid By Year
- Property Type Price
Frequently asked questions about Leiston
What is the average price for a property for sale in Leiston?
The average price for a property for sale in Leiston is £313,376. This amount is 2% lower than the average price in Suffolk. There are 869 property listings for sale in Leiston.
What locations have the most expensive properties for sale in Leiston?
The locations with the most expensive properties for sale in Leiston are Aldeburgh at an average of £653,821 and Saxmundham at an average of £459,038.
What locations have the most affordable properties for sale in Leiston?
The locations with the most affordable properties for sale in Leiston are Leiston at an average of £231,099 and Aldeburgh & Leiston at an average of £304,472.
Which train stations are available in or near Leiston?
Some of the train stations available in or near Leiston are Saxmundham, Darsham and Wickham Market.
Property Price Paid in Leiston by Year
The average sold property price by year was:
| Year | Average Sold Price | Price Change |
Sold Properties
|
|---|---|---|---|
| 2024 | £346,050 | 6% |
10 Properties |
| 2023 | £324,782 | 2% |
86 Properties |
| 2022 | £319,884 | 6% |
127 Properties |
| 2021 | £301,319 | 15% |
177 Properties |
| 2020 | £255,265 | -1% |
142 Properties |
| 2019 | £258,289 | 16% |
138 Properties |
| 2018 | £217,943 | -10% |
105 Properties |
| 2017 | £239,453 | 7% |
139 Properties |
| 2016 | £221,991 | 10% |
188 Properties |
| 2015 | £199,184 | -7% |
139 Properties |
| 2014 | £213,941 | 3% |
111 Properties |
| 2013 | £207,143 | -7% |
93 Properties |
| 2012 | £221,235 | 3% |
89 Properties |
| 2011 | £213,886 | -2% |
100 Properties |
| 2010 | £218,149 | 14% |
108 Properties |
| 2009 | £188,379 | 3% |
90 Properties |
| 2008 | £183,259 | -10% |
86 Properties |
| 2007 | £201,645 | 12% |
120 Properties |
| 2006 | £176,665 | 6% |
173 Properties |
| 2005 | £165,290 | -2% |
150 Properties |
| 2004 | £169,070 | 26% |
143 Properties |
| 2003 | £125,642 | 9% |
120 Properties |
| 2002 | £114,335 | 20% |
158 Properties |
| 2001 | £90,987 | 19% |
153 Properties |
| 2000 | £73,917 | 10% |
140 Properties |
| 1999 | £66,878 | 9% |
138 Properties |
| 1998 | £60,919 | 5% |
154 Properties |
| 1997 | £57,853 | 23% |
140 Properties |
| 1996 | £44,470 | -14% |
111 Properties |
| 1995 | £50,602 | - |
92 Properties |
Property Price per Property Type in Leiston
Here you can find historic sold price data in order to help with your property search.
The average Property Paid Price for specific property types in the last three years are:
| Property Type | Average Sold Price | Sold Properties |
|---|---|---|
| Flat | £188,736.00 | 36 Flats |
| Semi Detached House | £248,025.00 | 132 Semi Detached Houses |
| Terraced House | £226,655.00 | 116 Terraced Houses |
| Detached House | £513,144.00 | 116 Detached Houses |