
Houses for sale & to rent in Haslemere, Surrey
House Prices in Haslemere
Properties in Haslemere have an average house price of £709,443.00 and had 881 Property Transactions within the last 3 years.¹
Haslemere is an area in Surrey with 7,297 households², where the most expensive property was sold for £8,000,000.00.
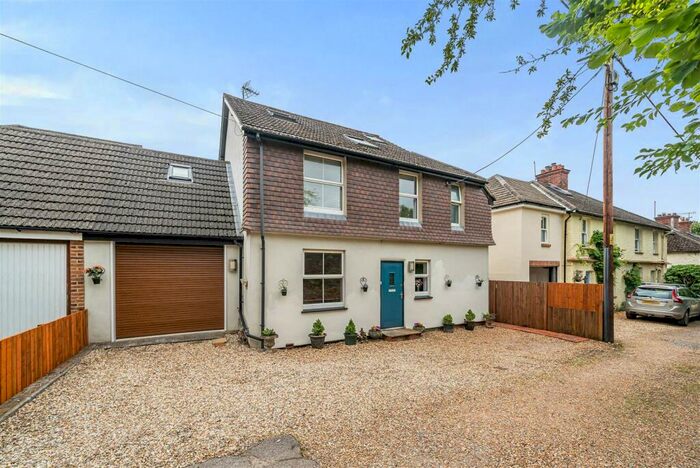
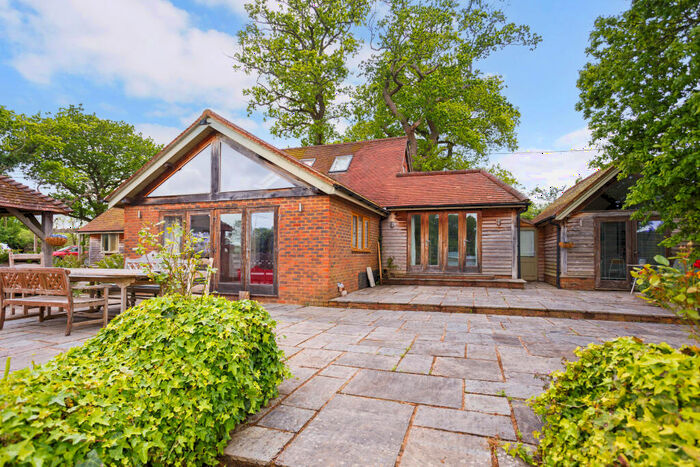
Properties for sale in Haslemere


Neighbourhoods in Haslemere
Navigate through our locations to find the location of your next house in Haslemere, Surrey for sale or to rent.
Transport in Haslemere
Please see below transportation links in this area:

- FAQ
- Price Paid By Year
- Property Type Price
Frequently asked questions about Haslemere
What is the average price for a property for sale in Haslemere?
The average price for a property for sale in Haslemere is £709,443. This amount is 14% higher than the average price in Surrey. There are 3,404 property listings for sale in Haslemere.
What locations have the most expensive properties for sale in Haslemere?
The locations with the most expensive properties for sale in Haslemere are Easebourne at an average of £1,306,666, Plaistow at an average of £1,111,454 and Fernhurst at an average of £794,105.
What locations have the most affordable properties for sale in Haslemere?
The locations with the most affordable properties for sale in Haslemere are Haslemere Critchmere And Shottermill at an average of £529,209 and Haslemere East And Grayswood at an average of £771,848.
Which train stations are available in or near Haslemere?
Some of the train stations available in or near Haslemere are Haslemere, Liphook and Witley.
Property Price Paid in Haslemere by Year
The average sold property price by year was:
| Year | Average Sold Price | Price Change |
Sold Properties
|
|---|---|---|---|
| 2024 | £601,854 | -20% |
12 Properties |
| 2023 | £723,684 | -1% |
188 Properties |
| 2022 | £727,958 | 5% |
322 Properties |
| 2021 | £688,975 | 5% |
359 Properties |
| 2020 | £652,784 | 0,2% |
254 Properties |
| 2019 | £651,766 | 14% |
229 Properties |
| 2018 | £560,310 | -5% |
295 Properties |
| 2017 | £589,739 | 14% |
255 Properties |
| 2016 | £506,899 | 3% |
298 Properties |
| 2015 | £491,557 | 2% |
363 Properties |
| 2014 | £481,429 | 6% |
404 Properties |
| 2013 | £454,082 | 4% |
334 Properties |
| 2012 | £436,078 | 13% |
261 Properties |
| 2011 | £381,521 | -15% |
274 Properties |
| 2010 | £437,219 | 18% |
314 Properties |
| 2009 | £356,884 | -20% |
261 Properties |
| 2008 | £429,913 | 6% |
205 Properties |
| 2007 | £403,823 | 11% |
432 Properties |
| 2006 | £357,859 | 5% |
508 Properties |
| 2005 | £339,761 | 2% |
384 Properties |
| 2004 | £332,170 | 8% |
359 Properties |
| 2003 | £305,425 | 11% |
389 Properties |
| 2002 | £271,867 | 13% |
441 Properties |
| 2001 | £235,841 | 5% |
402 Properties |
| 2000 | £223,418 | 18% |
384 Properties |
| 1999 | £183,603 | 11% |
459 Properties |
| 1998 | £163,048 | 12% |
385 Properties |
| 1997 | £143,425 | 10% |
442 Properties |
| 1996 | £129,660 | 4% |
393 Properties |
| 1995 | £124,774 | - |
294 Properties |
Property Price per Property Type in Haslemere
Here you can find historic sold price data in order to help with your property search.
The average Property Paid Price for specific property types in the last three years are:
| Property Type | Average Sold Price | Sold Properties |
|---|---|---|
| Semi Detached House | £539,259.00 | 208 Semi Detached Houses |
| Terraced House | £416,503.00 | 130 Terraced Houses |
| Detached House | £1,123,573.00 | 365 Detached Houses |
| Flat | £273,056.00 | 178 Flats |