
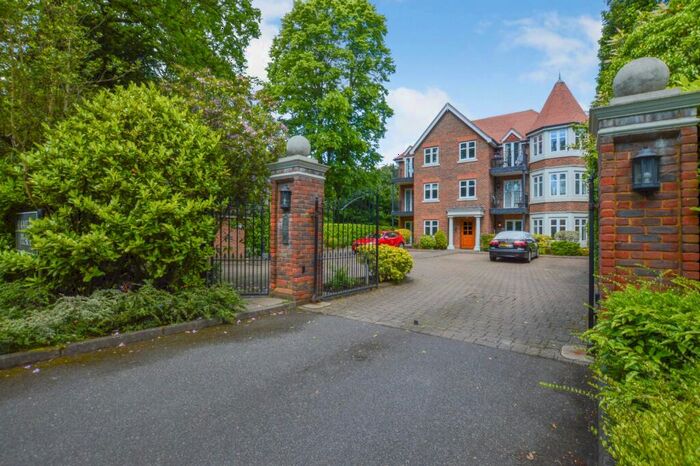
Houses for sale & to rent in West Byfleet, Surrey
House Prices in West Byfleet
Properties in West Byfleet have an average house price of £553,590.00 and had 769 Property Transactions within the last 3 years.¹
West Byfleet is an area in Surrey with 5,460 households², where the most expensive property was sold for £3,450,000.00.
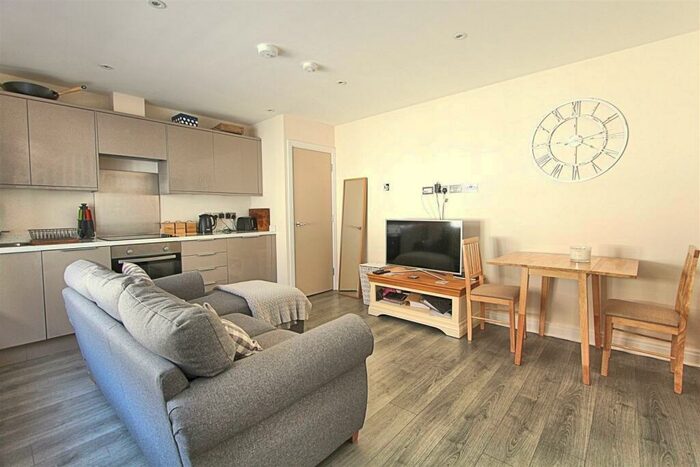
Properties for sale in West Byfleet


Neighbourhoods in West Byfleet
Navigate through our locations to find the location of your next house in West Byfleet, Surrey for sale or to rent.
Transport in West Byfleet
Please see below transportation links in this area:

- FAQ
- Price Paid By Year
- Property Type Price
Frequently asked questions about West Byfleet
What is the average price for a property for sale in West Byfleet?
The average price for a property for sale in West Byfleet is £553,590. This amount is 11% lower than the average price in Surrey. There are 3,411 property listings for sale in West Byfleet.
What locations have the most expensive properties for sale in West Byfleet?
The locations with the most expensive properties for sale in West Byfleet are Pyrford at an average of £1,174,642 and West Byfleet at an average of £721,228.
What locations have the most affordable properties for sale in West Byfleet?
The locations with the most affordable properties for sale in West Byfleet are Byfleet and West Byfleet at an average of £271,640 and Byfleet at an average of £429,531.
Which train stations are available in or near West Byfleet?
Some of the train stations available in or near West Byfleet are West Byfleet, Byfleet and New Haw and Weybridge.
Property Price Paid in West Byfleet by Year
The average sold property price by year was:
| Year | Average Sold Price | Price Change |
Sold Properties
|
|---|---|---|---|
| 2024 | £562,200 | 2% |
11 Properties |
| 2023 | £552,870 | -7% |
177 Properties |
| 2022 | £593,822 | 12% |
248 Properties |
| 2021 | £523,725 | 10% |
333 Properties |
| 2020 | £471,787 | 3% |
208 Properties |
| 2019 | £459,608 | 2% |
190 Properties |
| 2018 | £450,658 | -2% |
247 Properties |
| 2017 | £459,215 | 2% |
272 Properties |
| 2016 | £447,916 | 6% |
226 Properties |
| 2015 | £420,483 | 9% |
247 Properties |
| 2014 | £381,733 | 6% |
320 Properties |
| 2013 | £357,954 | 1% |
261 Properties |
| 2012 | £353,508 | 3% |
243 Properties |
| 2011 | £341,715 | -2% |
231 Properties |
| 2010 | £349,969 | 10% |
241 Properties |
| 2009 | £315,316 | -2% |
260 Properties |
| 2008 | £322,980 | -10% |
277 Properties |
| 2007 | £355,624 | 16% |
385 Properties |
| 2006 | £300,375 | 10% |
398 Properties |
| 2005 | £269,536 | -2% |
311 Properties |
| 2004 | £273,815 | 9% |
301 Properties |
| 2003 | £249,615 | 4% |
302 Properties |
| 2002 | £239,264 | 15% |
412 Properties |
| 2001 | £203,592 | 3% |
364 Properties |
| 2000 | £197,053 | 20% |
257 Properties |
| 1999 | £156,682 | -0,2% |
347 Properties |
| 1998 | £157,018 | 23% |
298 Properties |
| 1997 | £120,387 | 2% |
337 Properties |
| 1996 | £117,775 | -7% |
308 Properties |
| 1995 | £125,483 | - |
245 Properties |
Property Price per Property Type in West Byfleet
Here you can find historic sold price data in order to help with your property search.
The average Property Paid Price for specific property types in the last three years are:
| Property Type | Average Sold Price | Sold Properties |
|---|---|---|
| Semi Detached House | £502,100.00 | 192 Semi Detached Houses |
| Terraced House | £426,884.00 | 183 Terraced Houses |
| Detached House | £1,018,356.00 | 191 Detached Houses |
| Flat | £279,219.00 | 203 Flats |