
Houses for sale & to rent in Brechin, Angus
House Prices in Brechin
Properties in Brechin have an average house price of £162,887.00 and had 424 Property Transactions within the last 3 years.¹
Brechin is an area in Angus with 4,853 households², where the most expensive property was sold for £773,000.00.
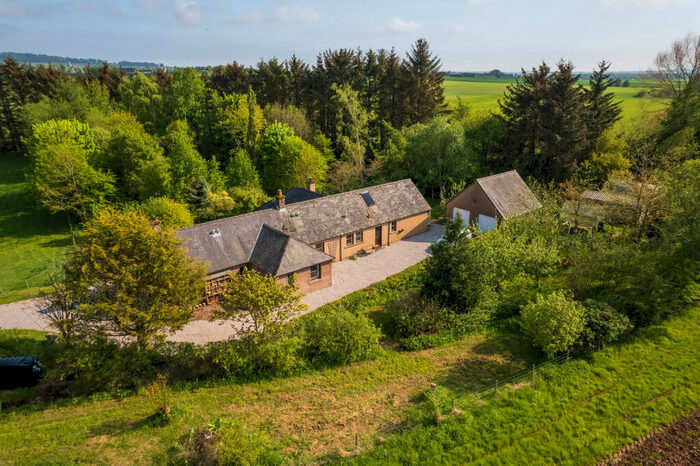
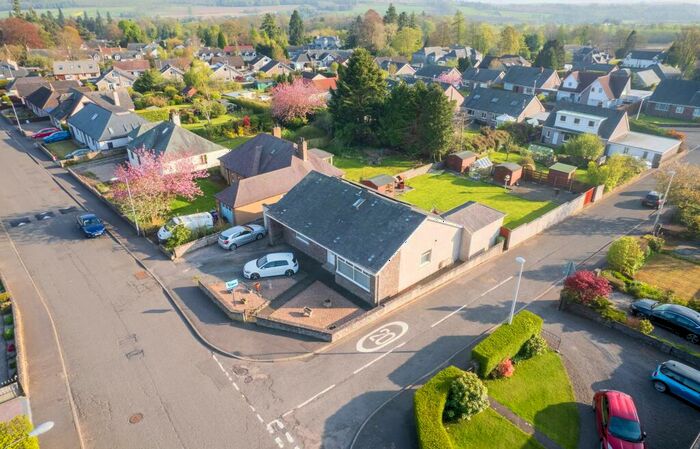
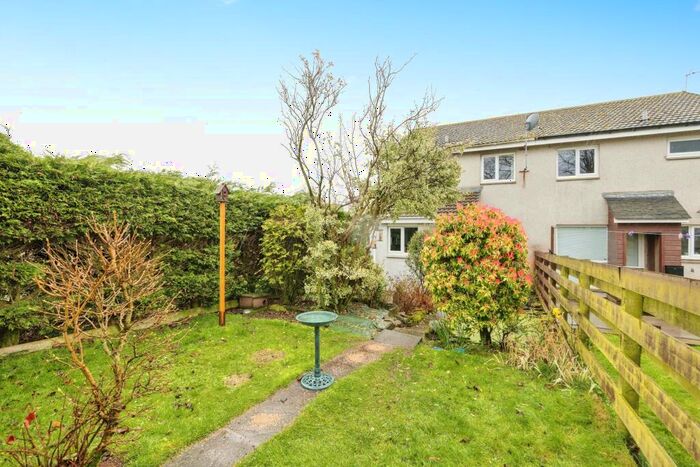
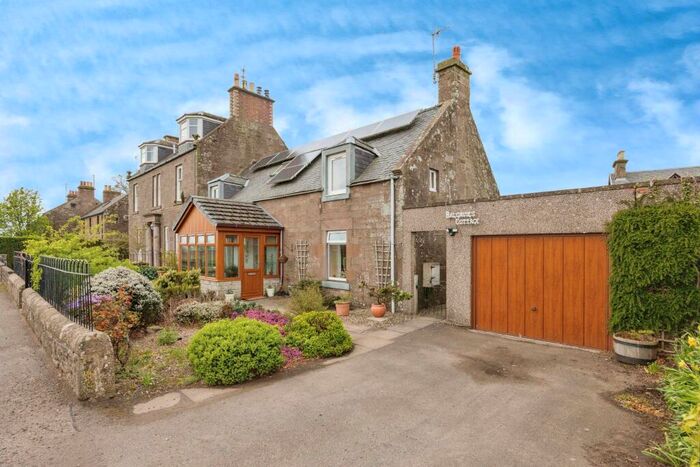
Properties for sale in Brechin


Neighbourhoods in Brechin
Navigate through our locations to find the location of your next house in Brechin, Angus for sale or to rent.
Transport in Brechin
Please see below transportation links in this area:

- FAQ
- Price Paid By Year
Frequently asked questions about Brechin
What is the average price for a property for sale in Brechin?
The average price for a property for sale in Brechin is £162,887. This amount is 13% lower than the average price in Angus. There are 2,455 property listings for sale in Brechin.
What locations have the most expensive properties for sale in Brechin?
The location with the most expensive properties for sale in Brechin is Brechin and Edzell at an average of £162,917.
What locations have the most affordable properties for sale in Brechin?
The location with the most affordable properties for sale in Brechin is Montrose and District at an average of £159,775.
Which train stations are available in or near Brechin?
Some of the train stations available in or near Brechin are Montrose, Laurencekirk and Arbroath.
Property Price Paid in Brechin by Year
The average sold property price by year was:
| Year | Average Sold Price | Price Change |
Sold Properties
|
|---|---|---|---|
| 2023 | £144,826 | -17% |
28 Properties |
| 2022 | £170,061 | 6% |
175 Properties |
| 2021 | £159,495 | 3% |
221 Properties |
| 2020 | £154,520 | 9% |
164 Properties |
| 2019 | £140,478 | -3% |
168 Properties |
| 2018 | £144,249 | 8% |
174 Properties |
| 2017 | £132,720 | -10% |
178 Properties |
| 2016 | £146,344 | -0,4% |
189 Properties |
| 2015 | £146,935 | -7% |
189 Properties |
| 2014 | £157,465 | -3% |
186 Properties |
| 2013 | £161,661 | 8% |
169 Properties |
| 2012 | £148,199 | 7% |
120 Properties |
| 2011 | £138,390 | -27% |
106 Properties |
| 2010 | £175,144 | 27% |
138 Properties |
| 2009 | £127,287 | 4% |
146 Properties |
| 2008 | £122,166 | 1% |
243 Properties |
| 2007 | £120,672 | 26% |
232 Properties |
| 2006 | £89,575 | 10% |
260 Properties |
| 2005 | £80,656 | 2% |
311 Properties |
| 2004 | £78,993 | 0,5% |
302 Properties |
| 2003 | £78,618 | 41% |
246 Properties |
| 2002 | £46,607 | 21% |
237 Properties |
| 2001 | £36,965 | - |
15 Properties |