
Houses for sale & to rent in Lockerbie, Dumfries and Galloway
House Prices in Lockerbie
Properties in Lockerbie have an average house price of £188,031.00 and had 420 Property Transactions within the last 3 years.¹
Lockerbie is an area in Dumfries and Galloway with 5,814 households², where the most expensive property was sold for £1,900,000.00.
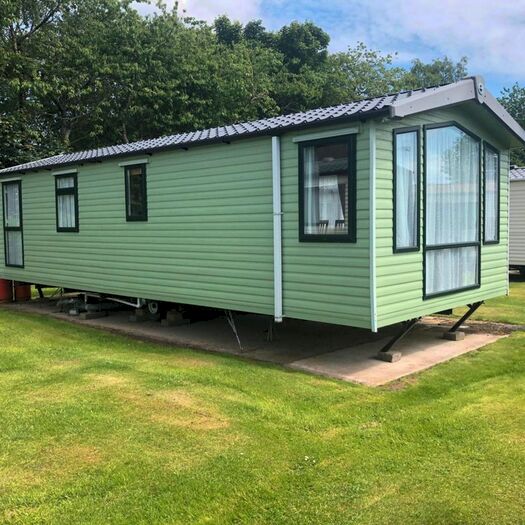
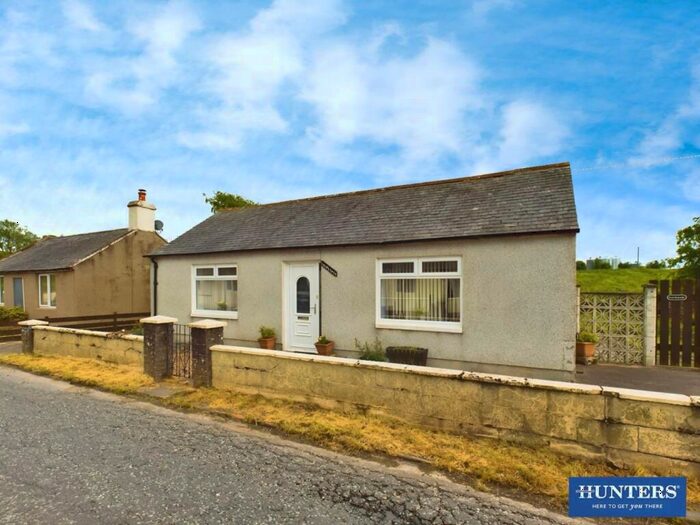
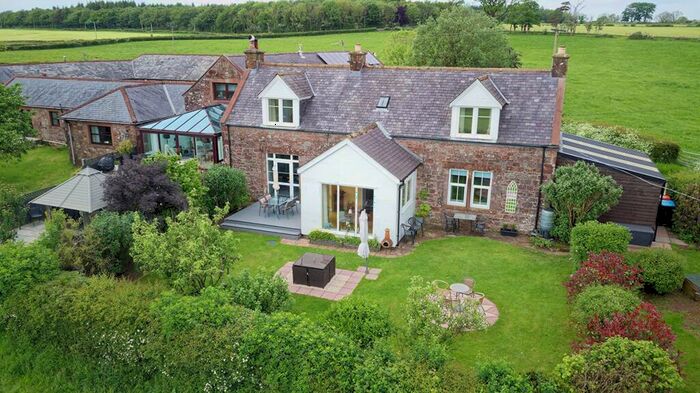
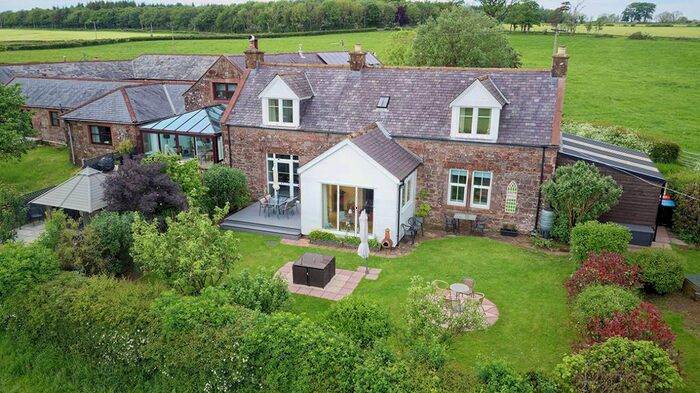
Properties for sale in Lockerbie


Neighbourhoods in Lockerbie
Navigate through our locations to find the location of your next house in Lockerbie, Dumfries and Galloway for sale or to rent.
Transport in Lockerbie
Please see below transportation links in this area:

- FAQ
- Price Paid By Year
Frequently asked questions about Lockerbie
What is the average price for a property for sale in Lockerbie?
The average price for a property for sale in Lockerbie is £188,031. This amount is 7% higher than the average price in Dumfries and Galloway. There are 3,414 property listings for sale in Lockerbie.
What locations have the most expensive properties for sale in Lockerbie?
The locations with the most expensive properties for sale in Lockerbie are Lochar at an average of £275,333 and Annandale East and Eskdale at an average of £233,972.
What locations have the most affordable properties for sale in Lockerbie?
The locations with the most affordable properties for sale in Lockerbie are Annandale North at an average of £173,387 and Annandale South at an average of £228,583.
Which train stations are available in or near Lockerbie?
Some of the train stations available in or near Lockerbie are Lockerbie, Annan and Dumfries.
Property Price Paid in Lockerbie by Year
The average sold property price by year was:
| Year | Average Sold Price | Price Change |
Sold Properties
|
|---|---|---|---|
| 2023 | £190,468 | - |
36 Properties |
| 2022 | £190,438 | 2% |
170 Properties |
| 2021 | £185,708 | 18% |
214 Properties |
| 2020 | £152,870 | -2% |
149 Properties |
| 2019 | £156,235 | 2% |
205 Properties |
| 2018 | £153,364 | 5% |
202 Properties |
| 2017 | £145,353 | -2% |
188 Properties |
| 2016 | £147,659 | -6% |
191 Properties |
| 2015 | £155,898 | 8% |
165 Properties |
| 2014 | £144,180 | -4% |
133 Properties |
| 2013 | £150,252 | -6% |
160 Properties |
| 2012 | £159,213 | 12% |
146 Properties |
| 2011 | £139,918 | -25% |
136 Properties |
| 2010 | £174,253 | 14% |
114 Properties |
| 2009 | £149,928 | -14% |
126 Properties |
| 2008 | £171,157 | 12% |
160 Properties |
| 2007 | £151,097 | 7% |
207 Properties |
| 2006 | £140,272 | 3% |
194 Properties |
| 2005 | £135,514 | 15% |
191 Properties |
| 2004 | £114,518 | 34% |
243 Properties |
| 2003 | £76,101 | 12% |
227 Properties |
| 2002 | £66,996 | 22% |
270 Properties |
| 2001 | £52,482 | - |
23 Properties |