
Houses for sale & to rent in Prestonpans, East Lothian
House Prices in Prestonpans
Properties in Prestonpans have an average house price of £271,873.00 and had 672 Property Transactions within the last 3 years.¹
Prestonpans is an area in East Lothian with 8,238 households², where the most expensive property was sold for £1,850,000.00.
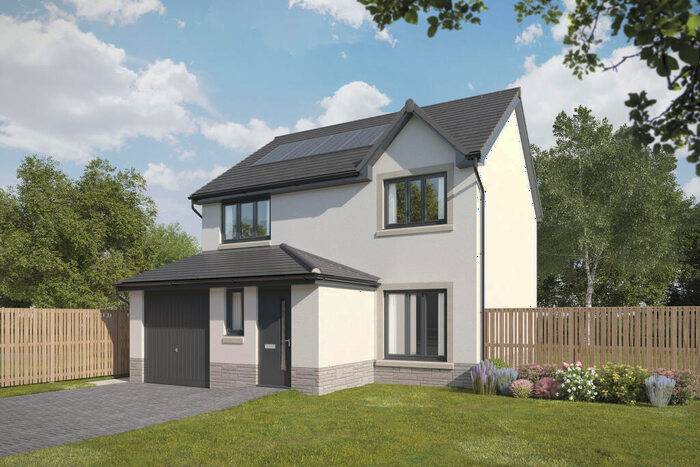
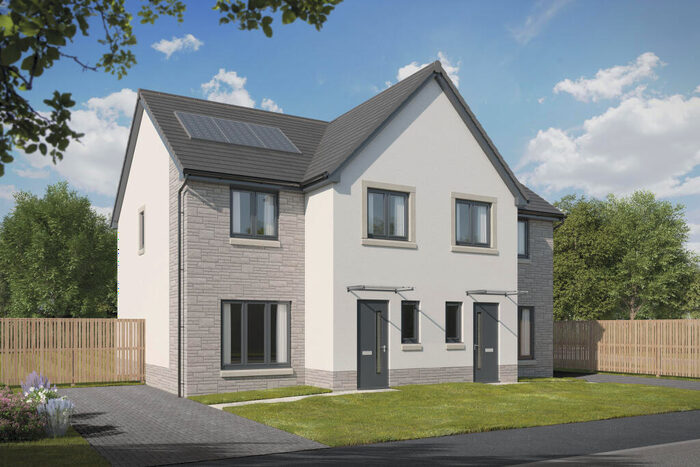
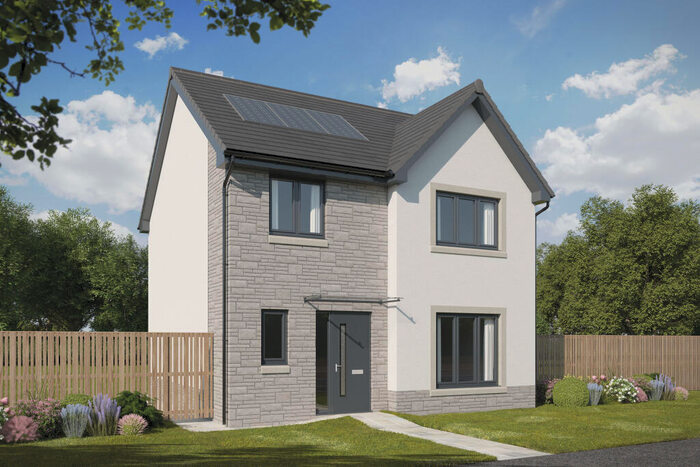
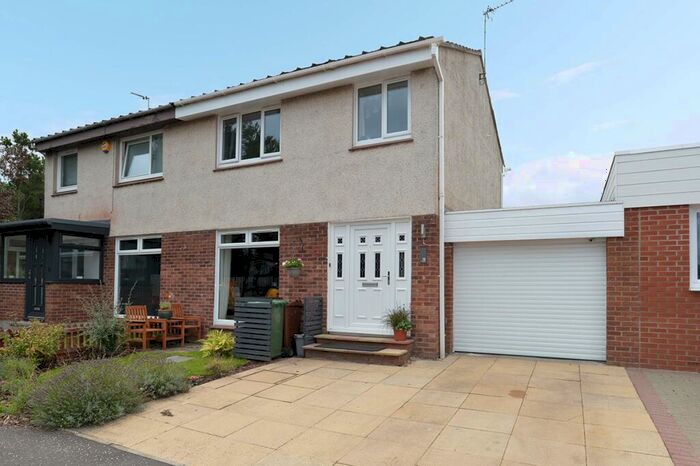
Properties for sale in Prestonpans


Neighbourhoods in Prestonpans
Navigate through our locations to find the location of your next house in Prestonpans, East Lothian for sale or to rent.
Transport in Prestonpans
Please see below transportation links in this area:

- FAQ
- Price Paid By Year
Frequently asked questions about Prestonpans
What is the average price for a property for sale in Prestonpans?
The average price for a property for sale in Prestonpans is £271,873. This amount is 10% lower than the average price in East Lothian. There are 1,924 property listings for sale in Prestonpans.
What locations have the most expensive properties for sale in Prestonpans?
The location with the most expensive properties for sale in Prestonpans is North Berwick Coastal at an average of £458,218.
What locations have the most affordable properties for sale in Prestonpans?
The location with the most affordable properties for sale in Prestonpans is Preston, Seton and Gosford at an average of £235,003.
Which train stations are available in or near Prestonpans?
Some of the train stations available in or near Prestonpans are Prestonpans, Longniddry and Wallyford.
Property Price Paid in Prestonpans by Year
The average sold property price by year was:
| Year | Average Sold Price | Price Change |
Sold Properties
|
|---|---|---|---|
| 2023 | £268,539 | -11% |
59 Properties |
| 2022 | £297,569 | 15% |
270 Properties |
| 2021 | £252,219 | 8% |
343 Properties |
| 2020 | £231,027 | 3% |
284 Properties |
| 2019 | £225,166 | 9% |
352 Properties |
| 2018 | £204,039 | 3% |
297 Properties |
| 2017 | £197,887 | 11% |
270 Properties |
| 2016 | £175,707 | -13% |
278 Properties |
| 2015 | £197,892 | 8% |
296 Properties |
| 2014 | £182,084 | 4% |
266 Properties |
| 2013 | £175,431 | 6% |
252 Properties |
| 2012 | £164,442 | -1% |
222 Properties |
| 2011 | £166,677 | -3% |
213 Properties |
| 2010 | £171,612 | -1% |
236 Properties |
| 2009 | £173,722 | 5% |
249 Properties |
| 2008 | £164,846 | -12% |
284 Properties |
| 2007 | £185,343 | 19% |
377 Properties |
| 2006 | £149,497 | 7% |
376 Properties |
| 2005 | £138,536 | -1% |
353 Properties |
| 2004 | £139,239 | 14% |
388 Properties |
| 2003 | £120,038 | 26% |
465 Properties |
| 2002 | £88,315 | 21% |
413 Properties |
| 2001 | £69,832 | - |
32 Properties |