
Houses for sale & to rent in Dingwall, Highland
House Prices in Dingwall
Properties in Dingwall have an average house price of £206,407.00 and had 471 Property Transactions within the last 3 years.¹
Dingwall is an area in Highland with 5,650 households², where the most expensive property was sold for £755,000.00.
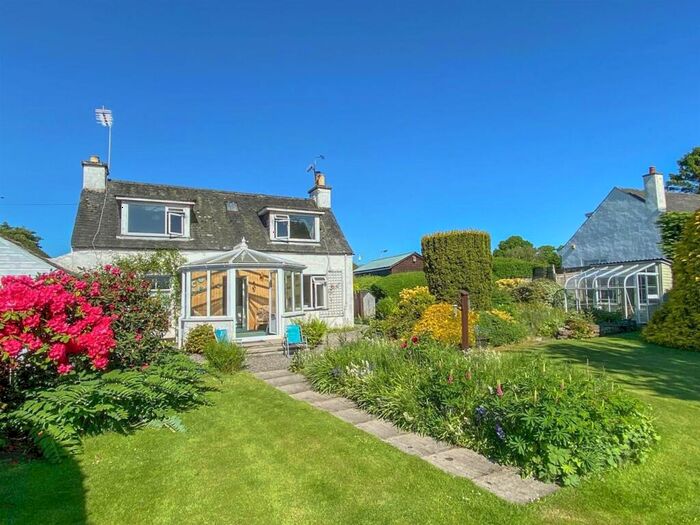
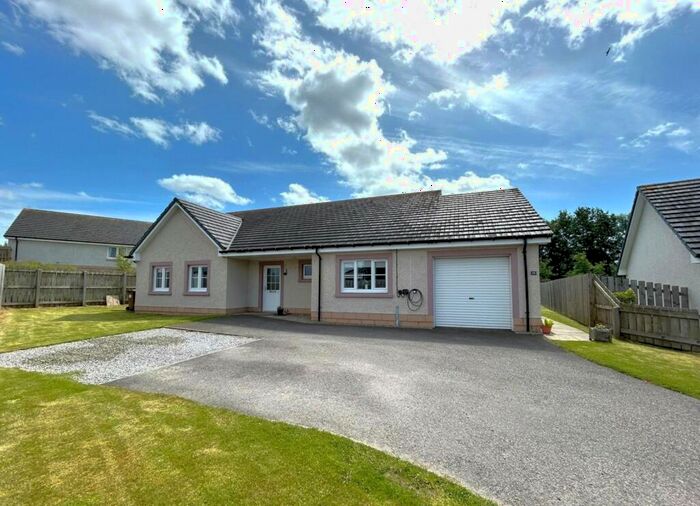
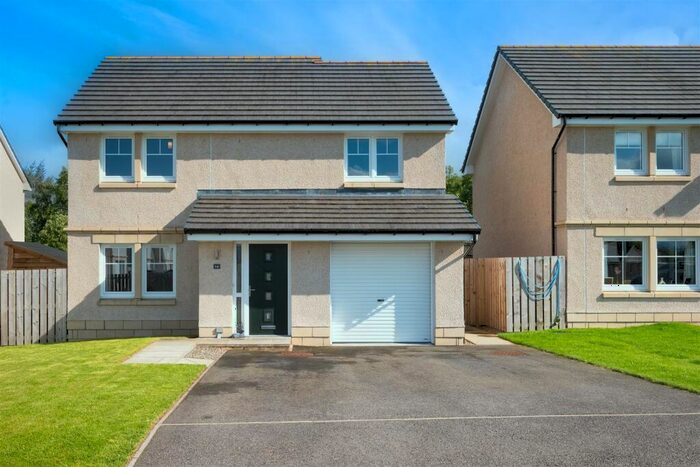
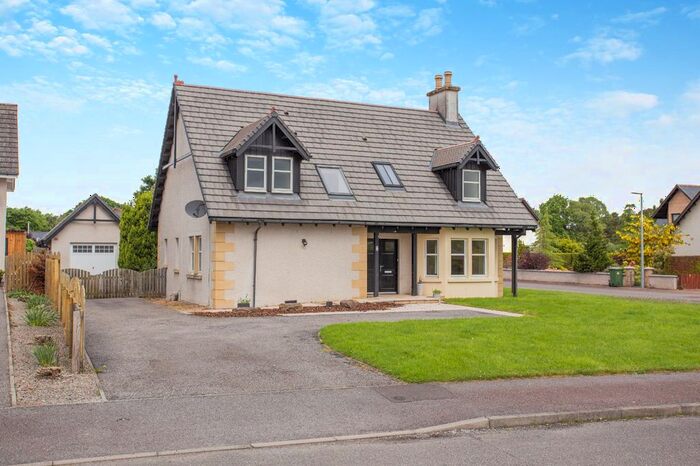
Properties for sale in Dingwall


Neighbourhoods in Dingwall
Navigate through our locations to find the location of your next house in Dingwall, Highland for sale or to rent.
Transport in Dingwall
Please see below transportation links in this area:

- FAQ
- Price Paid By Year
Frequently asked questions about Dingwall
What is the average price for a property for sale in Dingwall?
The average price for a property for sale in Dingwall is £206,407. This amount is 4% lower than the average price in Highland. There are 1,073 property listings for sale in Dingwall.
What locations have the most expensive properties for sale in Dingwall?
The locations with the most expensive properties for sale in Dingwall are Black Isle at an average of £289,709 and Cromarty Firth at an average of £222,957.
What locations have the most affordable properties for sale in Dingwall?
The location with the most affordable properties for sale in Dingwall is Dingwall and Seaforth at an average of £181,051.
Which train stations are available in or near Dingwall?
Some of the train stations available in or near Dingwall are Dingwall, Conon Bridge and Muir Of Ord.
Property Price Paid in Dingwall by Year
The average sold property price by year was:
| Year | Average Sold Price | Price Change |
Sold Properties
|
|---|---|---|---|
| 2023 | £224,487 | 7% |
27 Properties |
| 2022 | £208,597 | 3% |
190 Properties |
| 2021 | £202,848 | 6% |
254 Properties |
| 2020 | £189,678 | 7% |
188 Properties |
| 2019 | £176,674 | 1% |
219 Properties |
| 2018 | £174,176 | 2% |
218 Properties |
| 2017 | £170,701 | 2% |
191 Properties |
| 2016 | £167,296 | 3% |
202 Properties |
| 2015 | £162,929 | 7% |
199 Properties |
| 2014 | £150,711 | 2% |
201 Properties |
| 2013 | £147,549 | 5% |
158 Properties |
| 2012 | £139,805 | -10% |
137 Properties |
| 2011 | £153,405 | 5% |
117 Properties |
| 2010 | £146,341 | -4% |
118 Properties |
| 2009 | £152,056 | 4% |
148 Properties |
| 2008 | £146,401 | -16% |
157 Properties |
| 2007 | £170,101 | 16% |
231 Properties |
| 2006 | £142,501 | 19% |
238 Properties |
| 2005 | £114,958 | 21% |
271 Properties |
| 2004 | £90,836 | 9% |
302 Properties |
| 2003 | £82,708 | 10% |
216 Properties |
| 2002 | £74,089 | 16% |
57 Properties |
| 2001 | £62,368 | -3% |
27 Properties |
| 2000 | £63,971 | - |
12 Properties |