
Houses for sale & to rent in Penicuik, Midlothian
House Prices in Penicuik
Properties in Penicuik have an average house price of £248,559.00 and had 753 Property Transactions within the last 3 years.¹
Penicuik is an area in Midlothian with 7,011 households², where the most expensive property was sold for £1,066,000.00.
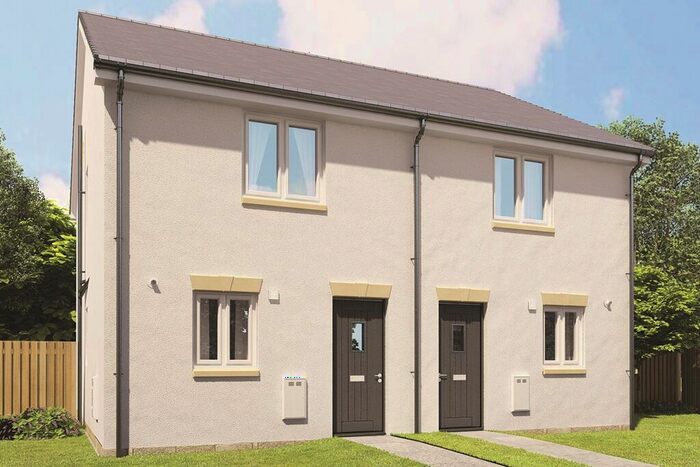
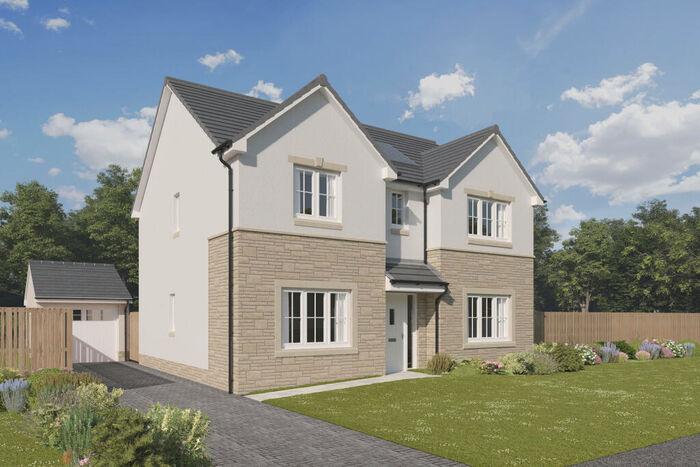
Properties for sale in Penicuik


Neighbourhoods in Penicuik
Navigate through our locations to find the location of your next house in Penicuik, Midlothian for sale or to rent.
Transport in Penicuik
Please see below transportation links in this area:
-
 Curriehill Station
 -
Wester Hailes Station
-
Kingsknowe Station
-
Eskbank Station
-
Newtongrange Station
-
Slateford Station
-
Gorebridge Station
-
Edinburgh Park Station
-
South Gyle Station
-
Haymarket Station
- FAQ
- Price Paid By Year
Frequently asked questions about Penicuik
What is the average price for a property for sale in Penicuik?
The average price for a property for sale in Penicuik is £248,559. This amount is 2% lower than the average price in Midlothian. There are 2,795 property listings for sale in Penicuik.
What locations have the most expensive properties for sale in Penicuik?
The location with the most expensive properties for sale in Penicuik is Midlothian West at an average of £281,285.
What locations have the most affordable properties for sale in Penicuik?
The location with the most affordable properties for sale in Penicuik is Penicuik at an average of £238,204.
Which train stations are available in or near Penicuik?
Some of the train stations available in or near Penicuik are Curriehill, Wester Hailes and Kingsknowe.
Property Price Paid in Penicuik by Year
The average sold property price by year was:
| Year | Average Sold Price | Price Change |
Sold Properties
|
|---|---|---|---|
| 2023 | £230,292 | -12% |
57 Properties |
| 2022 | £257,915 | 6% |
315 Properties |
| 2021 | £243,558 | 6% |
381 Properties |
| 2020 | £229,447 | 6% |
308 Properties |
| 2019 | £215,300 | 12% |
314 Properties |
| 2018 | £189,473 | 12% |
272 Properties |
| 2017 | £166,243 | 2% |
250 Properties |
| 2016 | £162,305 | -2% |
244 Properties |
| 2015 | £165,870 | 2% |
266 Properties |
| 2014 | £162,250 | 1% |
240 Properties |
| 2013 | £161,073 | 4% |
203 Properties |
| 2012 | £154,266 | 3% |
130 Properties |
| 2011 | £149,892 | 2% |
104 Properties |
| 2010 | £147,135 | 4% |
160 Properties |
| 2009 | £140,722 | -12% |
155 Properties |
| 2008 | £157,939 | 6% |
205 Properties |
| 2007 | £148,096 | 8% |
297 Properties |
| 2006 | £135,677 | 8% |
298 Properties |
| 2005 | £124,500 | 6% |
250 Properties |
| 2004 | £116,832 | 16% |
336 Properties |
| 2003 | £98,480 | 18% |
396 Properties |
| 2002 | £80,986 | -32% |
363 Properties |
| 2001 | £106,554 | 12% |
40 Properties |
| 2000 | £93,397 | - |
15 Properties |