
Houses for sale & to rent in Glasgow, North Lanarkshire
House Prices in Glasgow
Properties in Glasgow have an average house price of £164,004.00 and had 3,775 Property Transactions within the last 3 years.¹
Glasgow is an area in North Lanarkshire with 43,118 households², where the most expensive property was sold for £945,000.00.
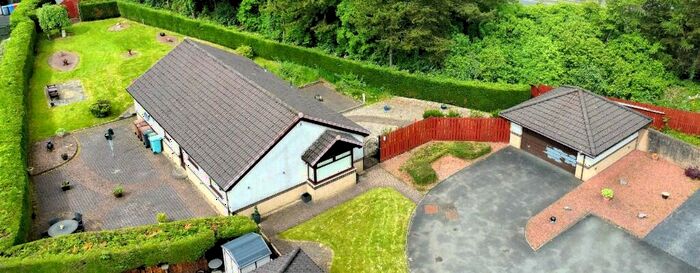
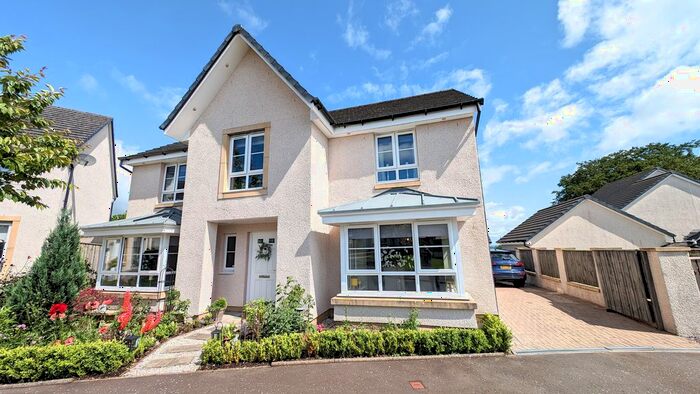
Properties for sale in Glasgow


Neighbourhoods in Glasgow
Navigate through our locations to find the location of your next house in Glasgow, North Lanarkshire for sale or to rent.
Transport in Glasgow
Please see below transportation links in this area:

- FAQ
- Price Paid By Year
Frequently asked questions about Glasgow
What is the average price for a property for sale in Glasgow?
The average price for a property for sale in Glasgow is £164,004. This amount is 11% higher than the average price in North Lanarkshire. There are more than 10,000 property listings for sale in Glasgow.
What locations have the most expensive properties for sale in Glasgow?
The locations with the most expensive properties for sale in Glasgow are Cumbernauld North at an average of £233,274, Stepps, Chryston and Muirhead at an average of £227,307 and Gartcosh, Glenboig and Moodiesburn at an average of £196,835.
What locations have the most affordable properties for sale in Glasgow?
The locations with the most affordable properties for sale in Glasgow are Cumbernauld East at an average of £93,036, Cumbernauld South at an average of £109,523 and Bellshill at an average of £123,485.
Which train stations are available in or near Glasgow?
Some of the train stations available in or near Glasgow are Gartcosh, Greenfaulds and Croy.
Property Price Paid in Glasgow by Year
The average sold property price by year was:
| Year | Average Sold Price | Price Change |
Sold Properties
|
|---|---|---|---|
| 2023 | £169,365 | -2% |
294 Properties |
| 2022 | £172,620 | 10% |
1,712 Properties |
| 2021 | £154,775 | -3% |
1,769 Properties |
| 2020 | £159,693 | -3% |
1,692 Properties |
| 2019 | £164,491 | 2% |
2,132 Properties |
| 2018 | £160,576 | 9% |
2,081 Properties |
| 2017 | £146,924 | 4% |
1,929 Properties |
| 2016 | £140,912 | - |
1,905 Properties |
| 2015 | £140,974 | 8% |
1,720 Properties |
| 2014 | £129,446 | 6% |
1,555 Properties |
| 2013 | £121,583 | -3% |
1,346 Properties |
| 2012 | £124,782 | 1% |
1,189 Properties |
| 2011 | £123,042 | -41% |
998 Properties |
| 2010 | £172,917 | 33% |
1,026 Properties |
| 2009 | £116,061 | -7% |
1,029 Properties |
| 2008 | £123,694 | -4% |
1,711 Properties |
| 2007 | £128,867 | 10% |
2,224 Properties |
| 2006 | £115,450 | 12% |
2,775 Properties |
| 2005 | £102,069 | 8% |
2,770 Properties |
| 2004 | £93,928 | 15% |
2,652 Properties |
| 2003 | £80,027 | 13% |
2,745 Properties |
| 2002 | £69,612 | 24% |
2,832 Properties |
| 2001 | £53,206 | - |
179 Properties |