
Houses for sale & to rent in Motherwell, North Lanarkshire
House Prices in Motherwell
Properties in Motherwell have an average house price of £156,310.00 and had 1,988 Property Transactions within the last 3 years.¹
Motherwell is an area in North Lanarkshire with 23,904 households², where the most expensive property was sold for £650,000.00.
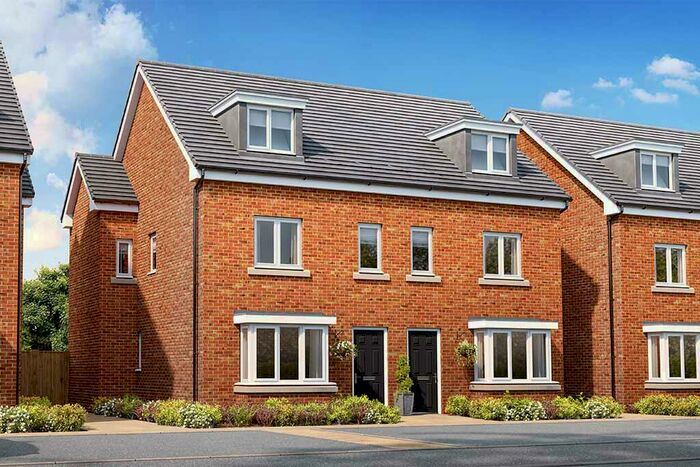
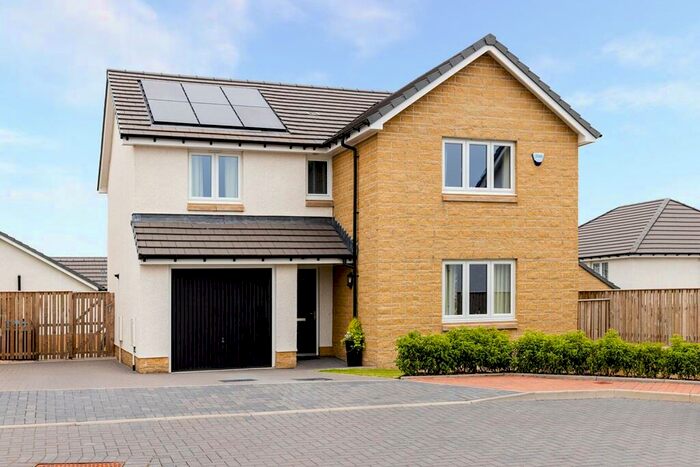
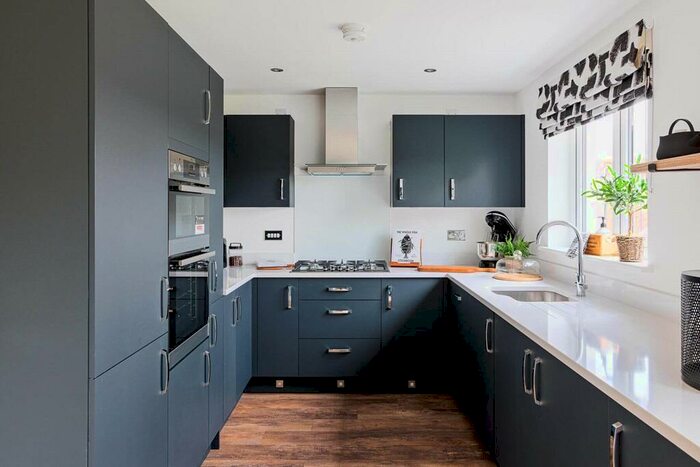
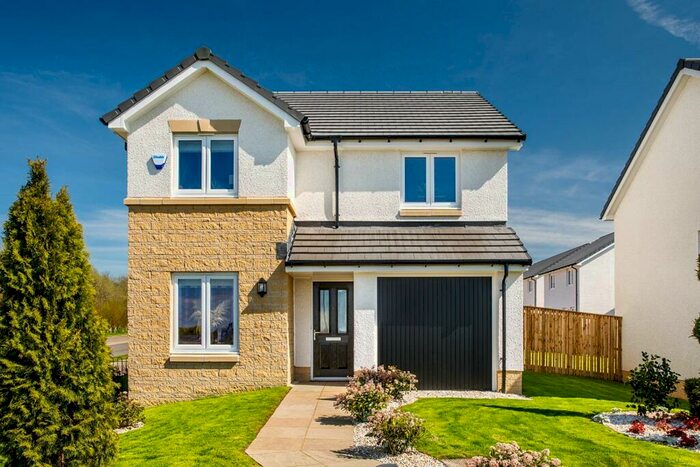
Properties for sale in Motherwell


Neighbourhoods in Motherwell
Navigate through our locations to find the location of your next house in Motherwell, North Lanarkshire for sale or to rent.
Transport in Motherwell
Please see below transportation links in this area:
-
 Motherwell Station
 -
Carfin Station
-
Holytown Station
-
Airbles Station
-
Shieldmuir Station
-
Bellshill Station
-
Cleland Station
-
Chatelherault Station
-
Wishaw Station
- FAQ
- Price Paid By Year
Frequently asked questions about Motherwell
What is the average price for a property for sale in Motherwell?
The average price for a property for sale in Motherwell is £156,310. This amount is 6% higher than the average price in North Lanarkshire. There are 9,779 property listings for sale in Motherwell.
What locations have the most expensive properties for sale in Motherwell?
The locations with the most expensive properties for sale in Motherwell are Fortissat at an average of £304,916, Murdostoun at an average of £197,376 and Mossend and Holytown at an average of £181,284.
What locations have the most affordable properties for sale in Motherwell?
The locations with the most affordable properties for sale in Motherwell are Motherwell North at an average of £126,957, Motherwell West at an average of £141,398 and Motherwell South East and Ravenscraig at an average of £176,450.
Which train stations are available in or near Motherwell?
Some of the train stations available in or near Motherwell are Motherwell, Carfin and Holytown.
Property Price Paid in Motherwell by Year
The average sold property price by year was:
| Year | Average Sold Price | Price Change |
Sold Properties
|
|---|---|---|---|
| 2023 | £148,465 | -7% |
171 Properties |
| 2022 | £159,164 | 2% |
840 Properties |
| 2021 | £155,230 | 5% |
977 Properties |
| 2020 | £147,756 | -0,2% |
814 Properties |
| 2019 | £148,004 | -2% |
1,055 Properties |
| 2018 | £151,337 | 8% |
1,091 Properties |
| 2017 | £139,057 | 4% |
1,038 Properties |
| 2016 | £133,226 | 4% |
1,009 Properties |
| 2015 | £128,081 | 3% |
1,010 Properties |
| 2014 | £124,591 | 1% |
864 Properties |
| 2013 | £123,399 | -3% |
729 Properties |
| 2012 | £126,769 | 2% |
682 Properties |
| 2011 | £123,902 | 10% |
608 Properties |
| 2010 | £111,106 | -42% |
521 Properties |
| 2009 | £157,743 | 26% |
553 Properties |
| 2008 | £116,643 | -6% |
896 Properties |
| 2007 | £123,687 | 22% |
1,104 Properties |
| 2006 | £96,170 | -1% |
1,271 Properties |
| 2005 | £97,358 | 28% |
1,249 Properties |
| 2004 | £70,164 | 19% |
1,101 Properties |
| 2003 | £56,754 | 10% |
1,086 Properties |
| 2002 | £51,345 | 12% |
1,183 Properties |
| 2001 | £45,364 | - |
94 Properties |