
Houses for sale & to rent in Bridge Of Weir, Renfrewshire
House Prices in Bridge Of Weir
Properties in Bridge Of Weir have an average house price of £271,612.00 and had 211 Property Transactions within the last 3 years.¹
Bridge Of Weir is an area in Renfrewshire with 2,159 households², where the most expensive property was sold for £925,000.00.
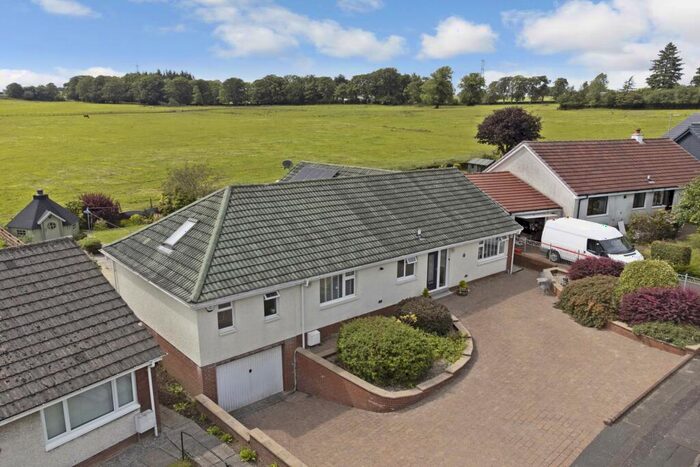
Properties for sale in Bridge Of Weir


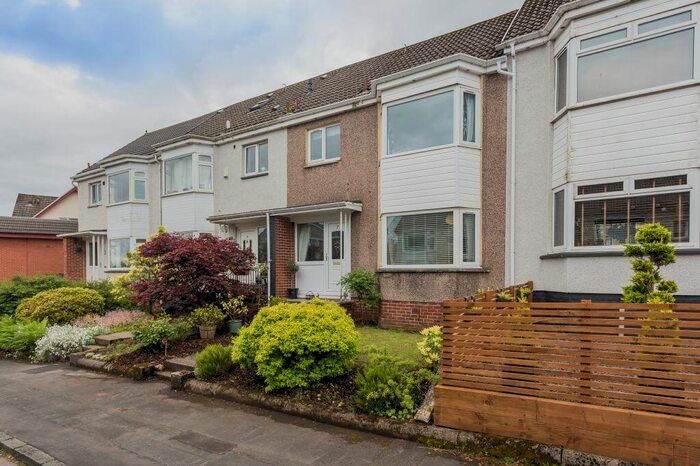


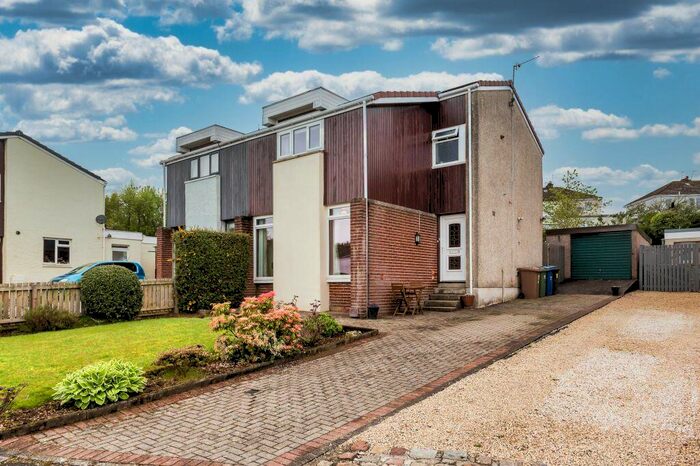

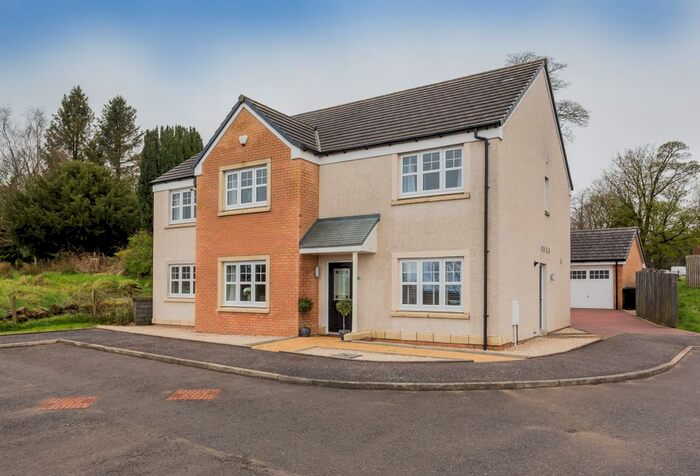


Previously listed properties in Bridge Of Weir


Neighbourhoods in Bridge Of Weir
Navigate through our locations to find the location of your next house in Bridge Of Weir, Renfrewshire for sale or to rent.
Transport in Bridge Of Weir
Please see below transportation links in this area:
-
 Milliken Park Station
 -
Howwood Station
-
Johnstone Station
-
Bishopton Station
-
Langbank Station
-
Lochwinnoch Station
- FAQ
- Price Paid By Year
Frequently asked questions about Bridge Of Weir
What is the average price for a property for sale in Bridge Of Weir?
The average price for a property for sale in Bridge Of Weir is £271,612. This amount is 54% higher than the average price in Renfrewshire. There are 305 property listings for sale in Bridge Of Weir.
What locations have the most expensive properties for sale in Bridge Of Weir?
The location with the most expensive properties for sale in Bridge Of Weir is Houston, Crosslee and Linwood at an average of £317,125.
What locations have the most affordable properties for sale in Bridge Of Weir?
The location with the most affordable properties for sale in Bridge Of Weir is Bishopton, Bridge of Weir and Langbank at an average of £271,395.
Which train stations are available in or near Bridge Of Weir?
Some of the train stations available in or near Bridge Of Weir are Milliken Park, Howwood and Johnstone.
Property Price Paid in Bridge Of Weir by Year
The average sold property price by year was:
| Year | Average Sold Price | Price Change |
Sold Properties
|
|---|---|---|---|
| 2023 | £294,760 | 2% |
19 Properties |
| 2022 | £289,819 | 14% |
93 Properties |
| 2021 | £250,066 | -9% |
99 Properties |
| 2020 | £272,850 | 7% |
91 Properties |
| 2019 | £254,586 | 3% |
72 Properties |
| 2018 | £248,166 | -2% |
130 Properties |
| 2017 | £253,294 | 23% |
106 Properties |
| 2016 | £196,218 | 4% |
100 Properties |
| 2015 | £188,379 | -9% |
81 Properties |
| 2014 | £204,742 | 8% |
80 Properties |
| 2013 | £189,296 | -0,1% |
72 Properties |
| 2012 | £189,461 | 5% |
60 Properties |
| 2011 | £179,252 | -12% |
57 Properties |
| 2010 | £200,210 | 3% |
84 Properties |
| 2009 | £194,890 | -11% |
68 Properties |
| 2008 | £216,349 | -1% |
77 Properties |
| 2007 | £219,360 | -95% |
93 Properties |
| 2006 | £427,835 | 61% |
133 Properties |
| 2005 | £168,488 | 14% |
138 Properties |
| 2004 | £145,252 | 24% |
121 Properties |
| 2003 | £110,197 | 12% |
135 Properties |
| 2002 | £97,130 | 9% |
131 Properties |
| 2001 | £88,259 | - |
17 Properties |