
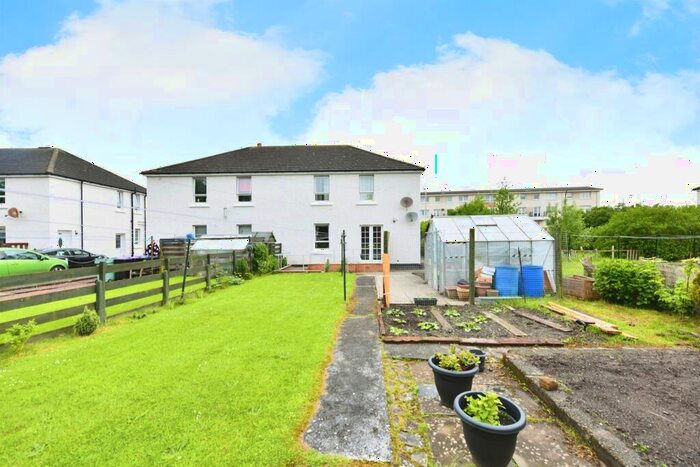
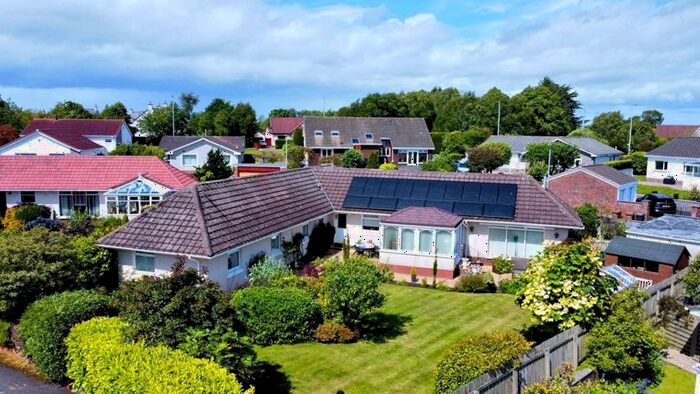
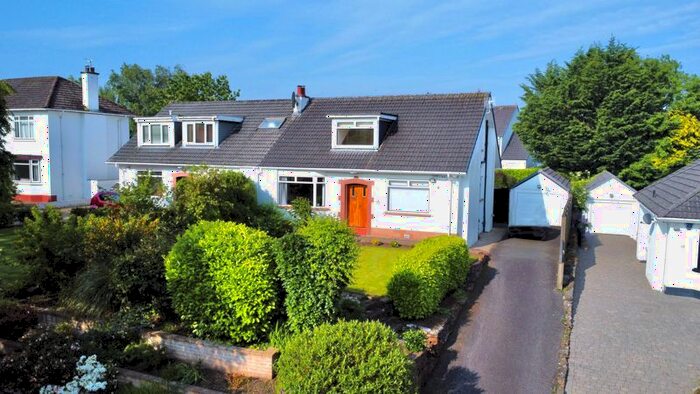
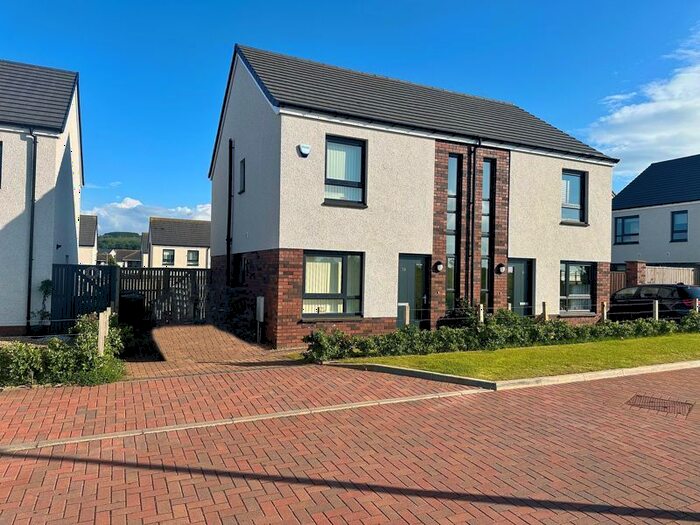
Houses for sale & to rent in Ayr, South Ayrshire
House Prices in Ayr
Properties in Ayr have an average house price of £189,333.00 and had 2,505 Property Transactions within the last 3 years.¹
Ayr is an area in South Ayrshire with 25,303 households², where the most expensive property was sold for £1,750,000.00.
Properties for sale in Ayr


Neighbourhoods in Ayr
Navigate through our locations to find the location of your next house in Ayr, South Ayrshire for sale or to rent.
Transport in Ayr
Please see below transportation links in this area:

- FAQ
- Price Paid By Year
Frequently asked questions about Ayr
What is the average price for a property for sale in Ayr?
The average price for a property for sale in Ayr is £189,333. This amount is 0.35% higher than the average price in South Ayrshire. There are 4,041 property listings for sale in Ayr.
What locations have the most expensive properties for sale in Ayr?
The locations with the most expensive properties for sale in Ayr are Ayr West at an average of £245,993, Maybole, North Carrick and Coylton at an average of £210,417 and Ayr East at an average of £169,185.
What locations have the most affordable properties for sale in Ayr?
The locations with the most affordable properties for sale in Ayr are Ayr North at an average of £113,028, Prestwick at an average of £157,219 and Kyle at an average of £162,316.
Which train stations are available in or near Ayr?
Some of the train stations available in or near Ayr are Ayr, Newton-On-Ayr and Prestwick.
Property Price Paid in Ayr by Year
The average sold property price by year was:
| Year | Average Sold Price | Price Change |
Sold Properties
|
|---|---|---|---|
| 2023 | £196,697 | 3% |
200 Properties |
| 2022 | £190,188 | 1% |
1,067 Properties |
| 2021 | £187,408 | 4% |
1,238 Properties |
| 2020 | £180,150 | 17% |
951 Properties |
| 2019 | £148,721 | -12% |
1,073 Properties |
| 2018 | £165,887 | 8% |
1,148 Properties |
| 2017 | £152,934 | 0,4% |
1,079 Properties |
| 2016 | £152,333 | -1% |
1,056 Properties |
| 2015 | £153,674 | 1% |
963 Properties |
| 2014 | £152,187 | -1% |
1,001 Properties |
| 2013 | £153,015 | 6% |
893 Properties |
| 2012 | £143,605 | -6% |
818 Properties |
| 2011 | £152,344 | -15% |
813 Properties |
| 2010 | £175,418 | 13% |
778 Properties |
| 2009 | £152,431 | -1% |
833 Properties |
| 2008 | £154,269 | -17% |
1,032 Properties |
| 2007 | £180,687 | 10% |
1,415 Properties |
| 2006 | £161,818 | 0,3% |
1,405 Properties |
| 2005 | £161,304 | 16% |
1,630 Properties |
| 2004 | £135,233 | 16% |
1,526 Properties |
| 2003 | £113,271 | -6% |
1,669 Properties |
| 2002 | £120,204 | 20% |
1,588 Properties |
| 2001 | £96,185 | - |
128 Properties |