
Houses for sale & to rent in Bridgend, Pen-y-bont ar Ogwr - Bridgend
House Prices in Bridgend
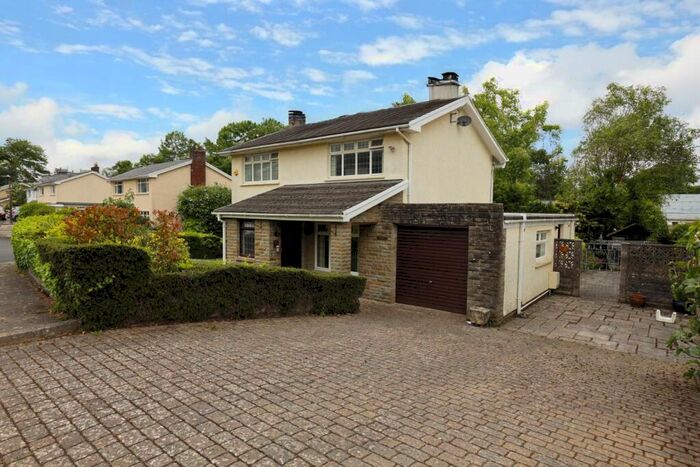
Properties in Bridgend have an average house price of £201,063.00 and had 4,914 Property Transactions within the last 3 years.¹
Bridgend is an area in Pen-y-bont ar Ogwr - Bridgend with 42,268 households², where the most expensive property was sold for £1,250,000.00.
Properties for sale in Bridgend


Neighbourhoods in Bridgend
Navigate through our locations to find the location of your next house in Bridgend, Pen-y-bont ar Ogwr - Bridgend for sale or to rent.
- Aberkenfig
- Bettws
- Blackmill
- Blaengarw
- Brackla
- Bryncethin
- Bryncoch
- Bryntirion, Laleston And Merthyr Mawr
- Cefn Cribwr
- Cefn Glas
- Coity
- Cornelly
- Coychurch Lower
- Felindre
- Hendre
- Litchard
- Llangeinor
- Llangewydd And Brynhyfryd
- Morfa
- Nant-y-moel
- Newcastle
- Newton
- Nottage
- Ogmore Vale
- Oldcastle
- Pen-y-fai
- Pendre
- Penprysg
- Pontycymmer
- Pyle
- Sarn
- Ynysawdre
Transport in Bridgend
Please see below transportation links in this area:

- FAQ
- Price Paid By Year
- Property Type Price
Frequently asked questions about Bridgend
What is the average price for a property for sale in Bridgend?
The average price for a property for sale in Bridgend is £201,063. This amount is 4% lower than the average price in Pen-y-bont ar Ogwr - Bridgend. There are more than 10,000 property listings for sale in Bridgend.
What locations have the most expensive properties for sale in Bridgend?
The locations with the most expensive properties for sale in Bridgend are Coychurch Lower at an average of £298,300, Pen-y-fai at an average of £297,858 and Bryntirion, Laleston And Merthyr Mawr at an average of £260,377.
What locations have the most affordable properties for sale in Bridgend?
The locations with the most affordable properties for sale in Bridgend are Blaengarw at an average of £98,830, Pontycymmer at an average of £99,605 and Nant-y-moel at an average of £105,103.
Which train stations are available in or near Bridgend?
Some of the train stations available in or near Bridgend are Sarn, Wildmill and Tondu.
Property Price Paid in Bridgend by Year
The average sold property price by year was:
| Year | Average Sold Price | Price Change |
Sold Properties
|
|---|---|---|---|
| 2024 | £213,710 | 3% |
92 Properties |
| 2023 | £208,030 | 1% |
1,129 Properties |
| 2022 | £205,238 | 6% |
1,702 Properties |
| 2021 | £192,958 | 8% |
1,991 Properties |
| 2020 | £178,370 | 7% |
1,491 Properties |
| 2019 | £166,741 | 3% |
1,990 Properties |
| 2018 | £162,346 | 2% |
2,064 Properties |
| 2017 | £158,689 | 4% |
1,969 Properties |
| 2016 | £152,842 | 5% |
1,848 Properties |
| 2015 | £144,517 | 2% |
1,967 Properties |
| 2014 | £141,411 | 3% |
1,827 Properties |
| 2013 | £137,707 | 2% |
1,466 Properties |
| 2012 | £134,992 | 0,2% |
1,115 Properties |
| 2011 | £134,659 | -0,3% |
1,124 Properties |
| 2010 | £135,002 | 3% |
1,094 Properties |
| 2009 | £131,494 | -3% |
1,001 Properties |
| 2008 | £135,627 | -3% |
1,184 Properties |
| 2007 | £139,885 | 3% |
2,210 Properties |
| 2006 | £136,100 | 4% |
2,270 Properties |
| 2005 | £130,556 | 8% |
1,601 Properties |
| 2004 | £120,348 | 22% |
1,972 Properties |
| 2003 | £94,425 | 22% |
2,588 Properties |
| 2002 | £73,536 | 8% |
2,261 Properties |
| 2001 | £67,361 | 2% |
2,379 Properties |
| 2000 | £66,137 | 10% |
1,770 Properties |
| 1999 | £59,417 | 10% |
1,494 Properties |
| 1998 | £53,400 | 3% |
1,262 Properties |
| 1997 | £51,642 | 4% |
1,215 Properties |
| 1996 | £49,502 | 7% |
1,189 Properties |
| 1995 | £46,216 | - |
1,149 Properties |
Property Price per Property Type in Bridgend
Here you can find historic sold price data in order to help with your property search.
The average Property Paid Price for specific property types in the last three years are:
| Property Type | Average Sold Price | Sold Properties |
|---|---|---|
| Terraced House | £139,462.00 | 1,535 Terraced Houses |
| Flat | £107,932.00 | 209 Flats |
| Semi Detached House | £192,733.00 | 1,958 Semi Detached Houses |
| Detached House | £308,596.00 | 1,212 Detached Houses |