
Houses for sale & to rent in Tenby, Sir Benfro - Pembrokeshire
House Prices in Tenby
Properties in Tenby have an average house price of £313,691.00 and had 534 Property Transactions within the last 3 years.¹
Tenby is an area in Sir Benfro - Pembrokeshire with 4,260 households², where the most expensive property was sold for £1,450,000.00.
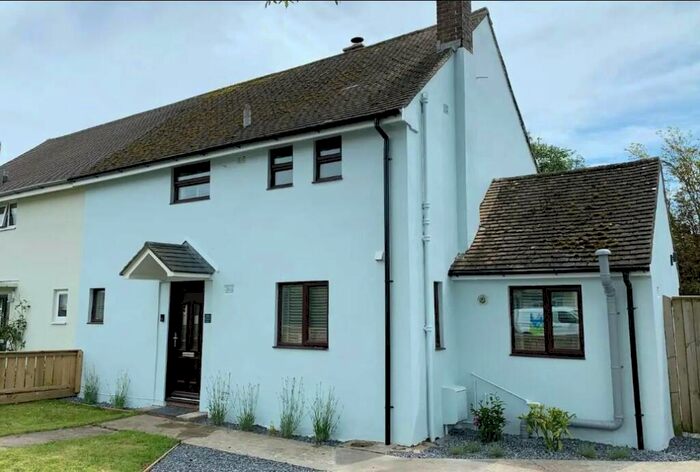
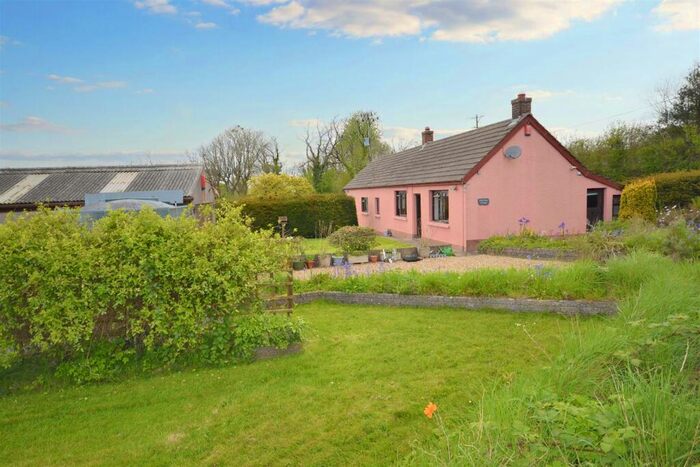
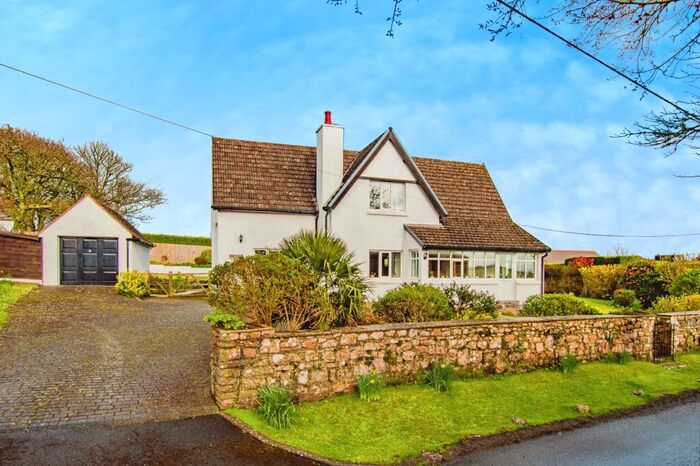
Properties for sale in Tenby


Neighbourhoods in Tenby
Navigate through our locations to find the location of your next house in Tenby, Sir Benfro - Pembrokeshire for sale or to rent.
Transport in Tenby
Please see below transportation links in this area:

- FAQ
- Price Paid By Year
- Property Type Price
Frequently asked questions about Tenby
What is the average price for a property for sale in Tenby?
The average price for a property for sale in Tenby is £313,691. This amount is 26% higher than the average price in Sir Benfro - Pembrokeshire. There are 2,732 property listings for sale in Tenby.
What locations have the most expensive properties for sale in Tenby?
The locations with the most expensive properties for sale in Tenby are East Williamston at an average of £411,454, Manorbier at an average of £337,451 and Tenby: North at an average of £321,600.
What locations have the most affordable properties for sale in Tenby?
The locations with the most affordable properties for sale in Tenby are Carew at an average of £241,796, Tenby: South at an average of £311,002 and Penally at an average of £313,495.
Which train stations are available in or near Tenby?
Some of the train stations available in or near Tenby are Penally, Tenby and Manorbier.
Property Price Paid in Tenby by Year
The average sold property price by year was:
| Year | Average Sold Price | Price Change |
Sold Properties
|
|---|---|---|---|
| 2024 | £277,554 | -18% |
11 Properties |
| 2023 | £327,747 | -4% |
123 Properties |
| 2022 | £341,722 | 17% |
187 Properties |
| 2021 | £282,832 | 6% |
213 Properties |
| 2020 | £266,714 | 6% |
153 Properties |
| 2019 | £251,868 | 4% |
207 Properties |
| 2018 | £241,369 | -6% |
186 Properties |
| 2017 | £255,857 | 14% |
239 Properties |
| 2016 | £220,897 | 2% |
186 Properties |
| 2015 | £217,124 | -1% |
204 Properties |
| 2014 | £219,398 | 1% |
195 Properties |
| 2013 | £217,778 | 4% |
130 Properties |
| 2012 | £209,663 | 4% |
122 Properties |
| 2011 | £202,049 | -15% |
124 Properties |
| 2010 | £233,117 | 14% |
121 Properties |
| 2009 | £199,637 | -11% |
139 Properties |
| 2008 | £221,358 | -3% |
140 Properties |
| 2007 | £228,141 | 11% |
199 Properties |
| 2006 | £202,619 | 4% |
199 Properties |
| 2005 | £195,026 | 9% |
182 Properties |
| 2004 | £176,530 | 21% |
211 Properties |
| 2003 | £138,702 | 16% |
230 Properties |
| 2002 | £116,426 | 27% |
231 Properties |
| 2001 | £84,432 | 7% |
208 Properties |
| 2000 | £78,583 | 15% |
207 Properties |
| 1999 | £66,704 | 4% |
189 Properties |
| 1998 | £63,963 | 5% |
181 Properties |
| 1997 | £60,901 | 7% |
195 Properties |
| 1996 | £56,636 | -5% |
138 Properties |
| 1995 | £59,244 | - |
144 Properties |
Property Price per Property Type in Tenby
Here you can find historic sold price data in order to help with your property search.
The average Property Paid Price for specific property types in the last three years are:
| Property Type | Average Sold Price | Sold Properties |
|---|---|---|
| Semi Detached House | £256,744.00 | 95 Semi Detached Houses |
| Terraced House | £319,431.00 | 114 Terraced Houses |
| Detached House | £392,651.00 | 182 Detached Houses |
| Flat | £246,455.00 | 143 Flats |