
Houses for sale & to rent in Ruthin, Sir Ddinbych - Denbighshire
House Prices in Ruthin
Properties in Ruthin have an average house price of £270,032.00 and had 460 Property Transactions within the last 3 years.¹
Ruthin is an area in Sir Ddinbych - Denbighshire with 4,417 households², where the most expensive property was sold for £930,000.00.
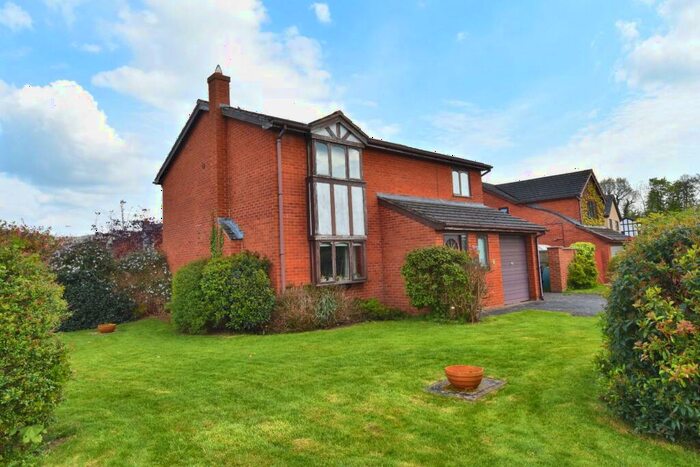
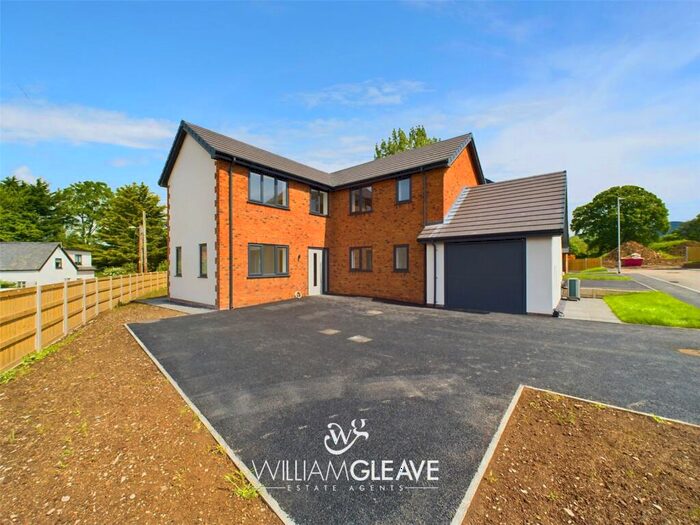
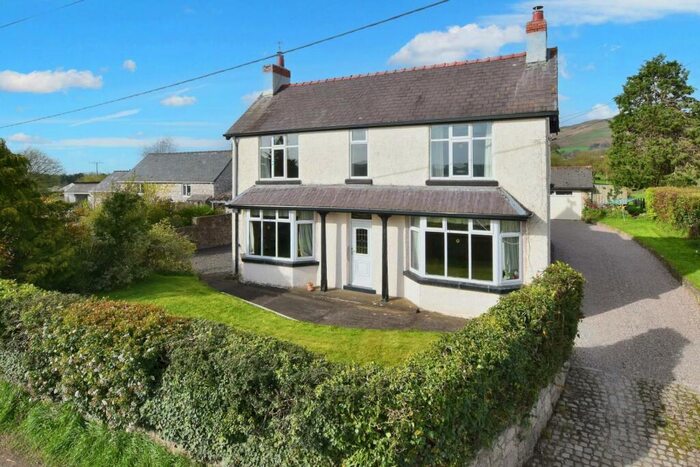
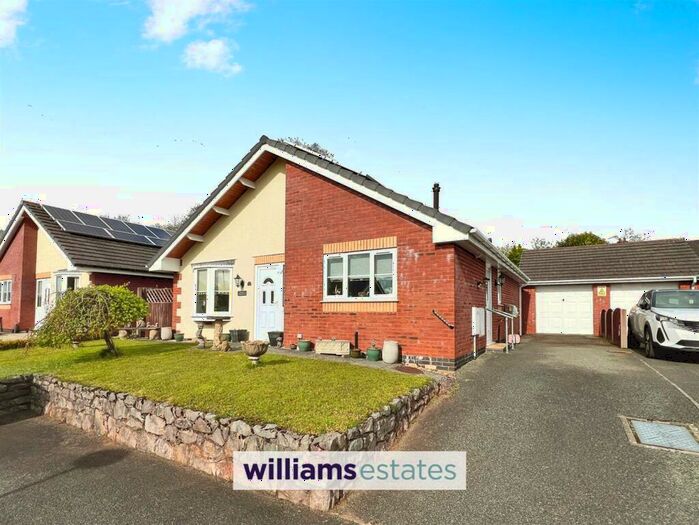
Properties for sale in Ruthin


Neighbourhoods in Ruthin
Navigate through our locations to find the location of your next house in Ruthin, Sir Ddinbych - Denbighshire for sale or to rent.
Transport in Ruthin
Please see below transportation links in this area:
-
 Penyffordd Station
 -
Buckley Station
-
Hope (Clwyd) Station
-
Caergwrle Station
-
Cefn-Y-Bedd Station
-
Gwersyllt Station
-
Flint Station
-
Hawarden Station
-
Wrexham General Station
-
Wrexham Central Station
- FAQ
- Price Paid By Year
- Property Type Price
Frequently asked questions about Ruthin
What is the average price for a property for sale in Ruthin?
The average price for a property for sale in Ruthin is £270,032. This amount is 24% higher than the average price in Sir Ddinbych - Denbighshire. There are 460 property listings for sale in Ruthin.
What locations have the most expensive properties for sale in Ruthin?
The locations with the most expensive properties for sale in Ruthin are Llanfair Dyffryn Clwyd/gwyddelwern at an average of £370,819, Llanbedr Dyffryn Clwyd/llangynhafal at an average of £366,606 and Llandyrnog at an average of £298,763.
What locations have the most affordable properties for sale in Ruthin?
The locations with the most affordable properties for sale in Ruthin are Ruthin at an average of £232,021, Llanrhaeadr-yng-nghinmeirch at an average of £287,632 and Efenechtyd at an average of £294,424.
Which train stations are available in or near Ruthin?
Some of the train stations available in or near Ruthin are Penyffordd, Buckley and Hope (Clwyd).
Property Price Paid in Ruthin by Year
The average sold property price by year was:
| Year | Average Sold Price | Price Change |
Sold Properties
|
|---|---|---|---|
| 2024 | £297,750 | 21% |
6 Properties |
| 2023 | £234,255 | -20% |
114 Properties |
| 2022 | £281,437 | -0,1% |
159 Properties |
| 2021 | £281,628 | 22% |
181 Properties |
| 2020 | £218,308 | 4% |
151 Properties |
| 2019 | £208,555 | -8% |
170 Properties |
| 2018 | £224,450 | 11% |
145 Properties |
| 2017 | £199,463 | -6% |
145 Properties |
| 2016 | £211,257 | 9% |
125 Properties |
| 2015 | £191,995 | 3% |
146 Properties |
| 2014 | £186,777 | 4% |
130 Properties |
| 2013 | £178,861 | -1% |
127 Properties |
| 2012 | £179,993 | -3% |
119 Properties |
| 2011 | £185,250 | 6% |
117 Properties |
| 2010 | £174,286 | -8% |
129 Properties |
| 2009 | £188,093 | -9% |
117 Properties |
| 2008 | £204,586 | 8% |
100 Properties |
| 2007 | £188,136 | 3% |
146 Properties |
| 2006 | £183,235 | 7% |
160 Properties |
| 2005 | £169,847 | 6% |
129 Properties |
| 2004 | £159,093 | 15% |
152 Properties |
| 2003 | £134,461 | 25% |
178 Properties |
| 2002 | £100,685 | 13% |
193 Properties |
| 2001 | £87,265 | 9% |
164 Properties |
| 2000 | £79,159 | 5% |
154 Properties |
| 1999 | £75,224 | 11% |
164 Properties |
| 1998 | £67,141 | -10% |
137 Properties |
| 1997 | £74,188 | 19% |
136 Properties |
| 1996 | £60,147 | -7% |
122 Properties |
| 1995 | £64,433 | - |
107 Properties |
Property Price per Property Type in Ruthin
Here you can find historic sold price data in order to help with your property search.
The average Property Paid Price for specific property types in the last three years are:
| Property Type | Average Sold Price | Sold Properties |
|---|---|---|
| Semi Detached House | £204,985.00 | 121 Semi Detached Houses |
| Detached House | £358,864.00 | 231 Detached Houses |
| Flat | £123,153.00 | 29 Flats |
| Terraced House | £163,830.00 | 79 Terraced Houses |