
Houses for sale & to rent in St Asaph, Sir Ddinbych - Denbighshire
House Prices in St Asaph
Properties in St Asaph have an average house price of £287,239.00 and had 277 Property Transactions within the last 3 years.¹
St Asaph is an area in Sir Ddinbych - Denbighshire with 2,290 households², where the most expensive property was sold for £1,300,000.00.
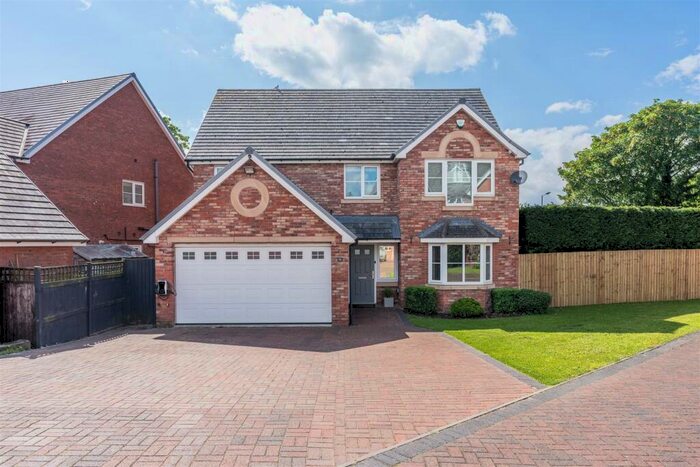
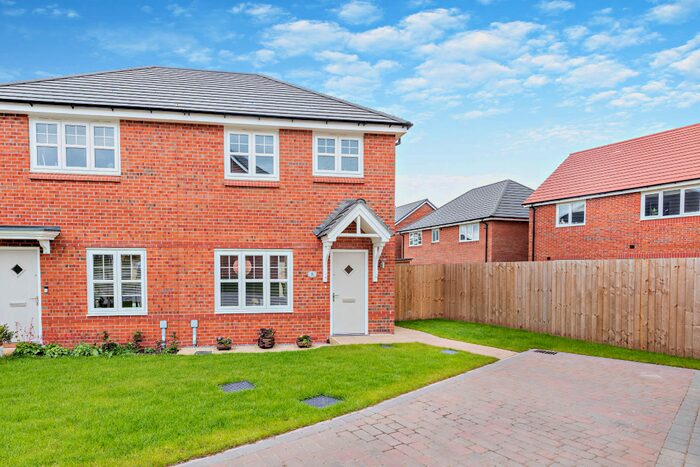
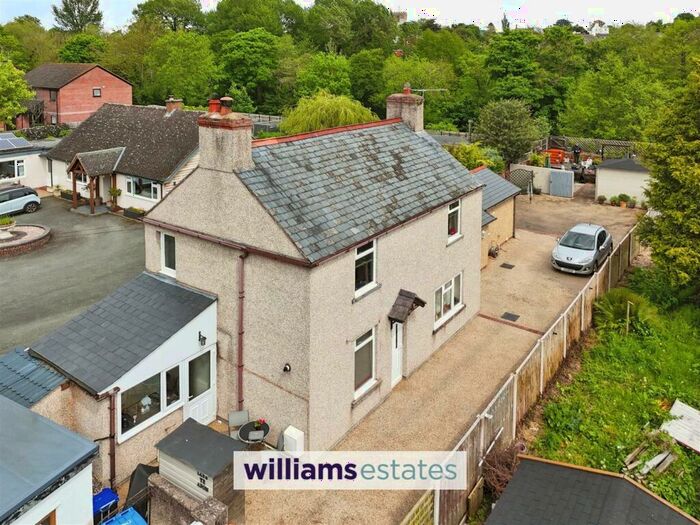
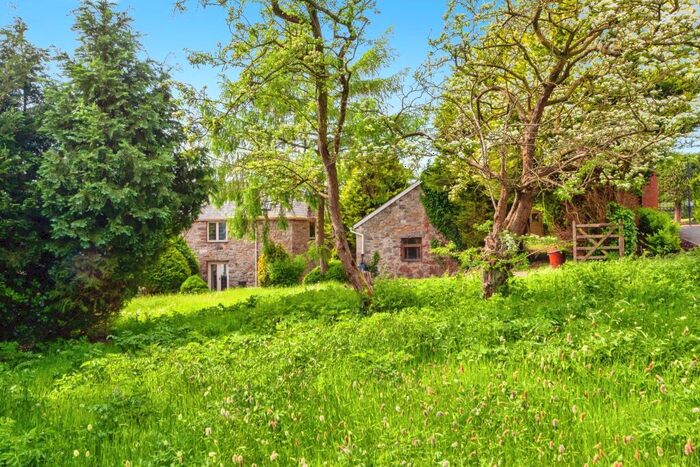
Properties for sale in St Asaph


Neighbourhoods in St Asaph
Navigate through our locations to find the location of your next house in St Asaph, Sir Ddinbych - Denbighshire for sale or to rent.
Transport in St Asaph
Please see below transportation links in this area:

- FAQ
- Price Paid By Year
- Property Type Price
Frequently asked questions about St Asaph
What is the average price for a property for sale in St Asaph?
The average price for a property for sale in St Asaph is £287,239. This amount is 30% higher than the average price in Sir Ddinbych - Denbighshire. There are 933 property listings for sale in St Asaph.
What locations have the most expensive properties for sale in St Asaph?
The locations with the most expensive properties for sale in St Asaph are Tremeirchion at an average of £414,966, St. Asaph East at an average of £303,131 and Trefnant at an average of £296,243.
What locations have the most affordable properties for sale in St Asaph?
The locations with the most affordable properties for sale in St Asaph are St. Asaph West at an average of £221,017 and Bodelwyddan at an average of £260,000.
Which train stations are available in or near St Asaph?
Some of the train stations available in or near St Asaph are Rhyl, Prestatyn and Abergele and Pensarn.
Property Price Paid in St Asaph by Year
The average sold property price by year was:
| Year | Average Sold Price | Price Change |
Sold Properties
|
|---|---|---|---|
| 2024 | £215,000 | -37% |
4 Properties |
| 2023 | £295,211 | 4% |
59 Properties |
| 2022 | £283,112 | -2% |
90 Properties |
| 2021 | £288,771 | 31% |
124 Properties |
| 2020 | £197,956 | -13% |
72 Properties |
| 2019 | £224,475 | 2% |
58 Properties |
| 2018 | £220,543 | 10% |
106 Properties |
| 2017 | £198,765 | -4% |
97 Properties |
| 2016 | £206,778 | 5% |
91 Properties |
| 2015 | £195,632 | 4% |
95 Properties |
| 2014 | £188,456 | 4% |
87 Properties |
| 2013 | £180,935 | -8% |
55 Properties |
| 2012 | £194,874 | 11% |
59 Properties |
| 2011 | £174,408 | -12% |
59 Properties |
| 2010 | £194,478 | 6% |
59 Properties |
| 2009 | £182,314 | 3% |
39 Properties |
| 2008 | £176,987 | -15% |
60 Properties |
| 2007 | £202,822 | 6% |
81 Properties |
| 2006 | £190,999 | 9% |
78 Properties |
| 2005 | £173,201 | -6% |
64 Properties |
| 2004 | £184,038 | 30% |
106 Properties |
| 2003 | £128,212 | 8% |
109 Properties |
| 2002 | £118,541 | 27% |
108 Properties |
| 2001 | £86,952 | 9% |
95 Properties |
| 2000 | £79,195 | 9% |
123 Properties |
| 1999 | £72,324 | 10% |
88 Properties |
| 1998 | £65,085 | 6% |
71 Properties |
| 1997 | £61,247 | -8% |
79 Properties |
| 1996 | £66,228 | 2% |
67 Properties |
| 1995 | £64,760 | - |
54 Properties |
Property Price per Property Type in St Asaph
Here you can find historic sold price data in order to help with your property search.
The average Property Paid Price for specific property types in the last three years are:
| Property Type | Average Sold Price | Sold Properties |
|---|---|---|
| Flat | £177,727.00 | 11 Flats |
| Semi Detached House | £221,157.00 | 60 Semi Detached Houses |
| Terraced House | £182,301.00 | 44 Terraced Houses |
| Detached House | £347,651.00 | 162 Detached Houses |