
Houses for sale & to rent in Monmouth, Sir Fynwy - Monmouthshire
House Prices in Monmouth
Properties in Monmouth have an average house price of £364,001.00 and had 716 Property Transactions within the last 3 years.¹
Monmouth is an area in Sir Fynwy - Monmouthshire with 6,117 households², where the most expensive property was sold for £1,875,000.00.
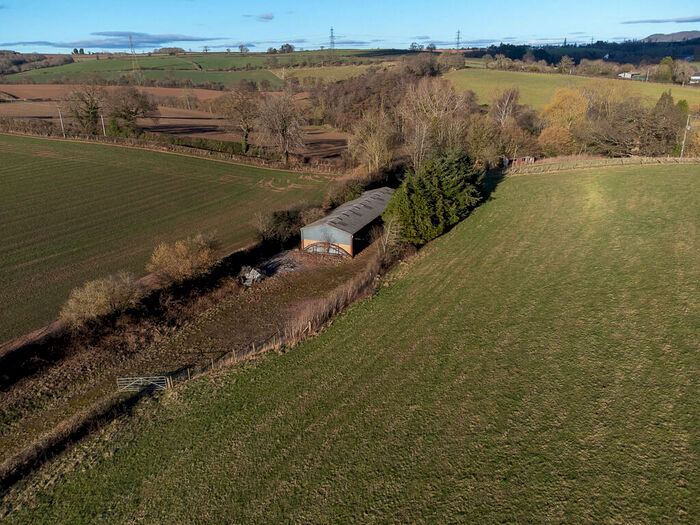
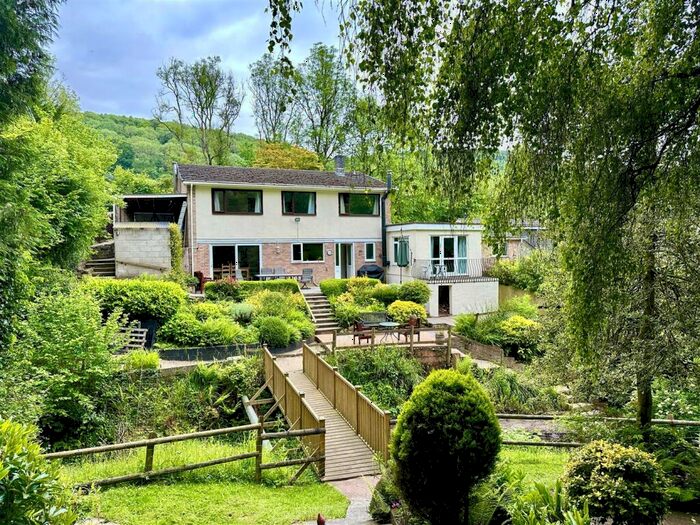
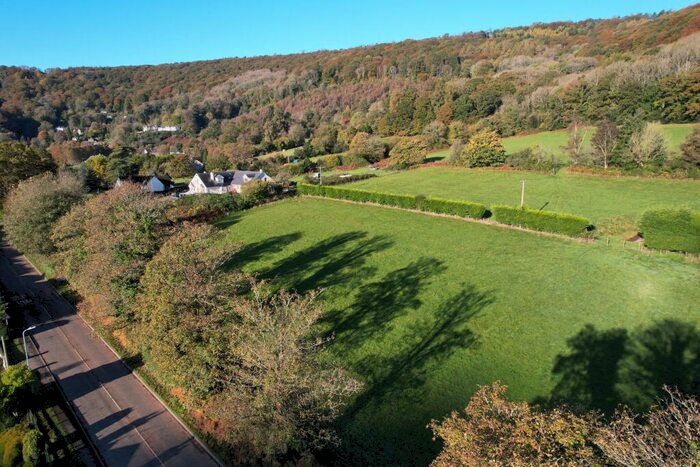
Properties for sale in Monmouth


Neighbourhoods in Monmouth
Navigate through our locations to find the location of your next house in Monmouth, Sir Fynwy - Monmouthshire for sale or to rent.
Transport in Monmouth
Please see below transportation links in this area:

- FAQ
- Price Paid By Year
- Property Type Price
Frequently asked questions about Monmouth
What is the average price for a property for sale in Monmouth?
The average price for a property for sale in Monmouth is £364,001. This amount is 5% higher than the average price in Sir Fynwy - Monmouthshire. There are 2,835 property listings for sale in Monmouth.
What locations have the most expensive properties for sale in Monmouth?
The locations with the most expensive properties for sale in Monmouth are Llantilio Crossenny at an average of £664,490, Trellech United at an average of £542,514 and Mitchel Troy at an average of £472,547.
What locations have the most affordable properties for sale in Monmouth?
The locations with the most affordable properties for sale in Monmouth are Overmonnow at an average of £205,547, Wyesham at an average of £265,020 and Drybridge at an average of £317,962.
Which train stations are available in or near Monmouth?
Some of the train stations available in or near Monmouth are Lydney, Chepstow and Abergavenny.
Property Price Paid in Monmouth by Year
The average sold property price by year was:
| Year | Average Sold Price | Price Change |
Sold Properties
|
|---|---|---|---|
| 2024 | £255,996 | -50% |
15 Properties |
| 2023 | £383,694 | 5% |
158 Properties |
| 2022 | £363,080 | 1% |
218 Properties |
| 2021 | £360,030 | 8% |
325 Properties |
| 2020 | £331,256 | 9% |
221 Properties |
| 2019 | £302,324 | 4% |
282 Properties |
| 2018 | £289,384 | 2% |
298 Properties |
| 2017 | £282,409 | -2% |
335 Properties |
| 2016 | £288,711 | 13% |
278 Properties |
| 2015 | £250,892 | -2% |
263 Properties |
| 2014 | £254,966 | 9% |
264 Properties |
| 2013 | £232,489 | 2% |
249 Properties |
| 2012 | £228,877 | -10% |
191 Properties |
| 2011 | £252,619 | 8% |
183 Properties |
| 2010 | £233,358 | -1% |
185 Properties |
| 2009 | £236,521 | -6% |
173 Properties |
| 2008 | £250,559 | 0,2% |
123 Properties |
| 2007 | £250,094 | 2% |
271 Properties |
| 2006 | £244,505 | 9% |
302 Properties |
| 2005 | £222,263 | 15% |
294 Properties |
| 2004 | £189,572 | 8% |
395 Properties |
| 2003 | £173,675 | 17% |
323 Properties |
| 2002 | £143,328 | 12% |
327 Properties |
| 2001 | £125,608 | 14% |
293 Properties |
| 2000 | £108,181 | 11% |
326 Properties |
| 1999 | £96,605 | 15% |
295 Properties |
| 1998 | £82,569 | 3% |
224 Properties |
| 1997 | £80,429 | 4% |
233 Properties |
| 1996 | £77,586 | 10% |
210 Properties |
| 1995 | £69,519 | - |
170 Properties |
Property Price per Property Type in Monmouth
Here you can find historic sold price data in order to help with your property search.
The average Property Paid Price for specific property types in the last three years are:
| Property Type | Average Sold Price | Sold Properties |
|---|---|---|
| Semi Detached House | £275,531.00 | 173 Semi Detached Houses |
| Terraced House | £264,392.00 | 129 Terraced Houses |
| Detached House | £495,312.00 | 338 Detached Houses |
| Flat | £150,473.00 | 76 Flats |